USGS 11262900 MUD SLOUGH NR GUSTINE CA

PROVISIONAL DATA SUBJECT TO REVISION

Click to hidestation-specific text
Click to enlarge
Site Photo
> Rating Information
This station managed by the Sacramento Field Office.

Available Parameters Available Period
  
2007-10-01  2024-04-19
1986-06-21  2024-04-19
2007-10-01  2024-04-19
2007-10-01  2024-04-19


 (7)
 

  -- or --


Summary of all available data for this site
Instantaneous-data availability statement
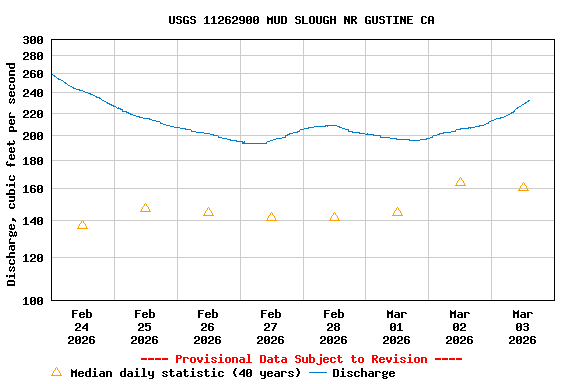

Temperature, water, degrees Celsius

Most recent instantaneous value: 25.0 04-19-2024   15:30 PDT
Graph of  Temperature, water, degrees Celsius

Add up to 2 more sites and replot for "Temperature, water, degrees Celsius"

?


Create presentation-quality / stand-alone graph.   Subscribe to WaterAlert      

See this graph on the Monitoring Location Pages


Discharge, cubic feet per second

Most recent instantaneous value: 79.0 04-19-2024   15:30 PDT
Graph of  Discharge, cubic feet per second

Add up to 2 more sites and replot for "Discharge, cubic feet per second"

?


Create presentation-quality / stand-alone graph.   Subscribe to WaterAlert      

See this graph on the Monitoring Location Pages


Daily discharge, cubic feet per second -- statistics for Apr 19 based on 38 water years of record more
Min
(1996)
25th
percen-
tile
Median Mean 75th
percen-
tile
Most Recent
Instantaneous
Value Apr 19
Max
(1986)
12.0 27 52 63 77 79.0 220


Gage height, feet

Most recent instantaneous value: 5.43 04-19-2024   15:30 PDT
Graph of  Gage height, feet

Add up to 2 more sites and replot for "Gage height, feet"

?


Create presentation-quality / stand-alone graph.   Subscribe to WaterAlert      

See this graph on the Monitoring Location Pages


Specific conductance, water, unfiltered, microsiemens per centimeter at 25 degrees Celsius

Most recent instantaneous value: 1800 04-19-2024   15:30 PDT
Graph of  Specific conductance, water, unfiltered, microsiemens per centimeter at 25 degrees Celsius

Add up to 2 more sites and replot for "Specific conductance, water, unfiltered, microsiemens per centimeter at 25 degrees Celsius"

?


Create presentation-quality / stand-alone graph.   Subscribe to WaterAlert      

See this graph on the Monitoring Location Pages