USGS 11461500 EF RUSSIAN R NR CALPELLA CA

PROVISIONAL DATA SUBJECT TO REVISION

Click to hidestation-specific text
> Rating Information
This station managed by the Ukiah Field Office.

Available Parameters Available Period
  
2019-10-31  2026-01-30
1987-10-01  2026-01-30
2007-10-01  2026-01-30
2019-10-31  2026-01-30
2019-10-31  2026-01-30
2019-10-31  2026-01-30
2024-02-12  2026-01-30
2019-10-31  2026-01-30


 (7)
 

  -- or --


Summary of all available data for this site
Instantaneous-data availability statement
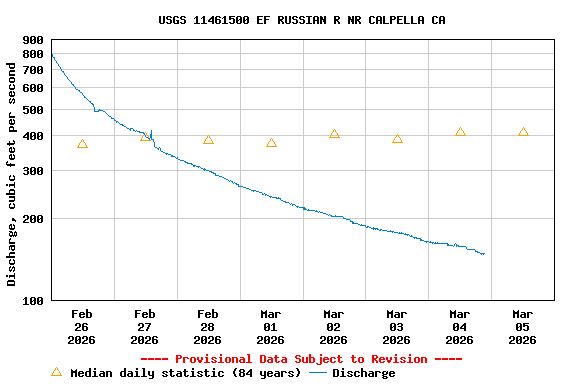

Temperature, water, degrees Celsius

Most recent instantaneous value: 9.2 01-30-2026   01:15 PST
Graph of  Temperature, water, degrees Celsius

Add up to 2 more sites and replot for "Temperature, water, degrees Celsius"

?


Create presentation-quality / stand-alone graph.   Subscribe to WaterAlert      

See this graph on the Monitoring Location Pages


Discharge, cubic feet per second

Most recent instantaneous value: 67.2 01-30-2026   01:15 PST
Graph of  Discharge, cubic feet per second

Add up to 2 more sites and replot for "Discharge, cubic feet per second"

?


Create presentation-quality / stand-alone graph.   Subscribe to WaterAlert      

See this graph on the Monitoring Location Pages


Daily discharge, cubic feet per second -- statistics for Jan 30 based on 84 water years of record more
Min
(2014)
Most Recent
Instantaneous
Value Jan 30
25th
percen-
tile
Median Mean 75th
percen-
tile
Max
(1967)
11.3 67.2 201 393 450 618 1500


Gage height, feet

Most recent instantaneous value: 6.10 01-30-2026   01:15 PST
Graph of  Gage height, feet

Add up to 2 more sites and replot for "Gage height, feet"

?


Create presentation-quality / stand-alone graph.   Subscribe to WaterAlert      

See this graph on the Monitoring Location Pages


Specific conductance, water, unfiltered, microsiemens per centimeter at 25 degrees Celsius

Most recent instantaneous value: 231 01-30-2026   01:15 PST
Graph of  Specific conductance, water, unfiltered, microsiemens per centimeter at 25 degrees Celsius

Add up to 2 more sites and replot for "Specific conductance, water, unfiltered, microsiemens per centimeter at 25 degrees Celsius"

?


Create presentation-quality / stand-alone graph.   Subscribe to WaterAlert      

See this graph on the Monitoring Location Pages


Dissolved oxygen, water, unfiltered, milligrams per liter

Most recent instantaneous value: 11.1 01-30-2026   01:15 PST
Graph of  Dissolved oxygen, water, unfiltered, milligrams per liter

Add up to 2 more sites and replot for "Dissolved oxygen, water, unfiltered, milligrams per liter"

?


Create presentation-quality / stand-alone graph.   Subscribe to WaterAlert      

See this graph on the Monitoring Location Pages


pH, water, unfiltered, field, standard units

Most recent instantaneous value: 8.0 01-30-2026   01:15 PST
Graph of  pH, water, unfiltered, field, standard units

Add up to 2 more sites and replot for "pH, water, unfiltered, field, standard units"

?


Create presentation-quality / stand-alone graph.   Subscribe to WaterAlert      

See this graph on the Monitoring Location Pages


Stream water level elevation above NAVD 1988, in feet

Most recent instantaneous value: 796.84 01-30-2026   01:15 PST
Graph of  Stream water level elevation above NAVD 1988, in feet

Add up to 2 more sites and replot for "Stream water level elevation above NAVD 1988, in feet"

?


Create presentation-quality / stand-alone graph.   Subscribe to WaterAlert      

See this graph on the Monitoring Location Pages


Turbidity, water, unfiltered, monochrome near infra-red LED light, 780-900 nm, detection angle 90 +-2.5 degrees, formazin nephelometric units (FNU)

Most recent instantaneous value: 6.1 01-30-2026   01:15 PST
Graph of  Turbidity, water, unfiltered, monochrome near infra-red LED light, 780-900 nm, detection angle 90 +-2.5 degrees, formazin nephelometric units (FNU)

Add up to 2 more sites and replot for "Turbidity, water, unfiltered, monochrome near infra-red LED light, 780-900 nm, detection angle 90 +-2.5 degrees, formazin nephelometric units (FNU)"

?


Create presentation-quality / stand-alone graph.   Subscribe to WaterAlert      

See this graph on the Monitoring Location Pages