PROVISIONAL DATA SUBJECT TO REVISION
Click to hidestation-specific text
 Rating Information
Summary of all available data for this site
Instantaneous-data availability statement
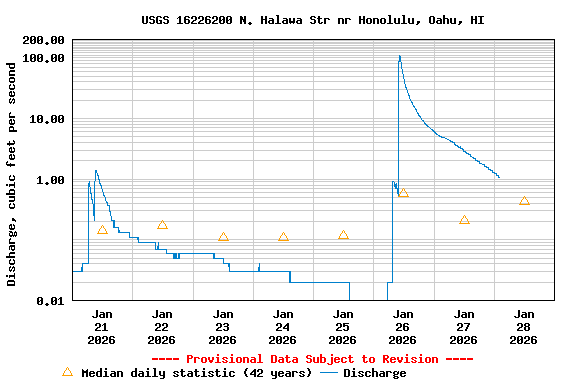
| Min (1986) | 25th percen- tile | Median | Most Recent Instantaneous Value Jan 28 | 75th percen- tile | Mean | Max (1988) |
|---|---|---|---|---|---|---|
| 0.00 | 0.02 | 0.43 | 1.14 | 4.1 | 5.3 | 51.0 |

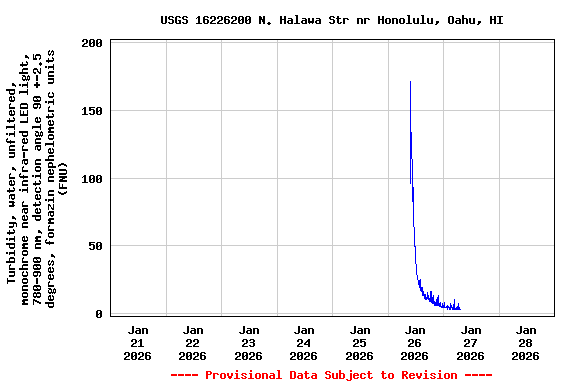
Turbidity, water, unfiltered, monochrome near infra-red LED light, 780-900 nm, detection angle 90 +-2.5 degrees, formazin nephelometric units (FNU), [YSI] |
||
|
||
Suspended sediment concentration, milligrams per liter |
||
|
||
Suspended sediment discharge, short tons per day |
||
|
||
![]() U.S. Department of the Interior |
U.S. Geological Survey
U.S. Department of the Interior |
U.S. Geological Survey
Title: USGS Current Conditions for the Nation
URL:
Page Contact Information: Hawaii Water Data Support Team
Page Last Modified: 2026-01-28 06:30:49 EST
6.68 5.22 sdww01