LOCATION.--Lat 42°04'30.1", long
74°58'34.6" referenced to North American Datum of
1983, Delaware County, NY, Hydrologic Unit 02040102, on left
bank 0.5 mi downstream from Downsville Dam, at downstream end
of outlet channel of Pepacton Reservoir, and 1.0 mi east of
Downsville.
DRAINAGE AREA.--372 mi².
PERIOD OF RECORD.--July 1941 to current year.
REVISIONS HISTORY.--WDR NY-82-1: Drainage area.
WDR-US-2006: 2004-05 (M). Datum of gage was corrected on Feb.
7, 2022, from 1,094.92 ft above NGVD of 1929 (levels by Board
of Water Supply, City of New York) to 1,094.92 ft above Mean
Sea Level Datum of Board of Water Supply, City of New York
(levels by Board of Water Supply, City of New York).
GAGE.--Water-stage recorder and concrete control. Datum
of gage is 1,094.92 ft above Mean Sea Level Datum of Board of
Water Supply, City of New York (levels by Board of Water
Supply, City of New York) and 1,093.67 ft above NAVD of 1988.
Prior to Sept. 26, 1941, nonrecording gage, and Sept. 26, 1941
to June 27, 1955, water-stage recorder, at site 0.8 mi
downstream at datum 7.03 ft lower.
REMARKS.--Subsequent to September 1954, entire flow from
drainage area controlled by Pepacton Reservoir (station
01416900). Part of flow diverted for New York City municipal
supply. Remainder of flow (except for conservation releases and
spill) impounded for release during periods of low flow in the
lower Delaware River basin, as directed by the Delaware River
Master.
Water Years 2014-22: Records good.
EXTREMES FOR PERIOD OF RECORD.--Maximum discharge, since
construction of Pepacton Reservoir in 1954, 20,200 ft³/s, Sept.
18, 2004, gage height, 12.08 ft; minimum discharge, 0.3 ft³/s,
Oct. 11, 1954; minimum gage height, 1.39 ft, Jan. 17,
1964.
EXTREMES OUTSIDE PERIOD OF RECORD.--Flood of Oct. 9,
1903, reached a stage of about 16 ft (at former site and
datum).
EXTREMES FOR PERIOD PRIOR TO REGULATION.--Maximum
discharge, prior to construction of Pepacton Reservoir in 1954,
23,900 ft³/s, Nov. 26, 1950, gage height, 14.52 ft, site and
datum then in use.
PERIOD OF DAILY RECORD1.--WATER TEMPERATURE:
July 2019 to current year.
INSTRUMENTATION1.--Water-temperature recorder
provides 15-minute-interval readings.
EXTREMES FOR PERIOD OF DAILY RECORD1.--WATER
TEMPERATURE: Maximum, 16.4 °C, July 18, 2021; minimum, 2.2 °C,
Mar. 1, 2020.
1 Water-Quality Records

 Site Information
 WaterAlert – get an
email or text (SMS) alert based on your chosen threshold.
WaterAlert – get an
email or text (SMS) alert based on your chosen threshold.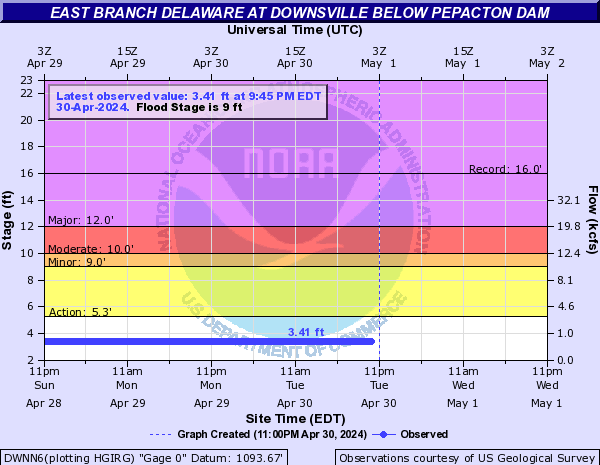
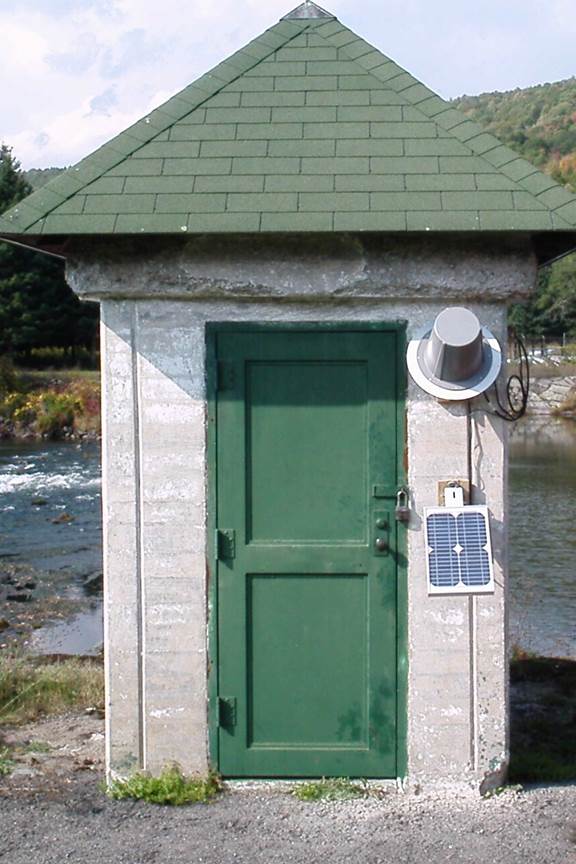 Station image