PROVISIONAL DATA SUBJECT TO REVISION
Click to hidestation-specific text
Funding for this site is provided by:
 Site Information
LOCATION.--Lat 43°15'27.7", long
77°26'48.7" referenced to North American Datum of
1983, Monroe County, NY, Hydrologic Unit 04140101, on left bank
on downstream side of bridge on Holt Road, 0.1 mi downstream
from small right-bank tributary, 0.4 mi upstream from mouth,
and 3.6 mi northwest of Webster.
DRAINAGE AREA.--9.69 mi².
PERIOD OF RECORD.--May 2021 to current year.
GAGE.--Water-stage recorder and crest-stage gage. Datum of gage is 254.73 ft above NAVD of 1988.
REMARKS.--Some regulation by upstream flood retention reservoirs. Water Years 2021-23: Records fair except those for estimated daily discharges, which are poor.
EXTREMES FOR PERIOD OF RECORD.--Maximum discharge, 578 ft³/s, Oct. 30, 2021, gage height, 6.02 ft; minimum discharge, about 0.02 ft³/s, part or all of each day Aug. 15-21, 2022, but may have been less during these days; minimum gage height not determined.
 WaterAlert – get an
email or text (SMS) alert based on your chosen threshold.
WaterAlert – get an
email or text (SMS) alert based on your chosen threshold.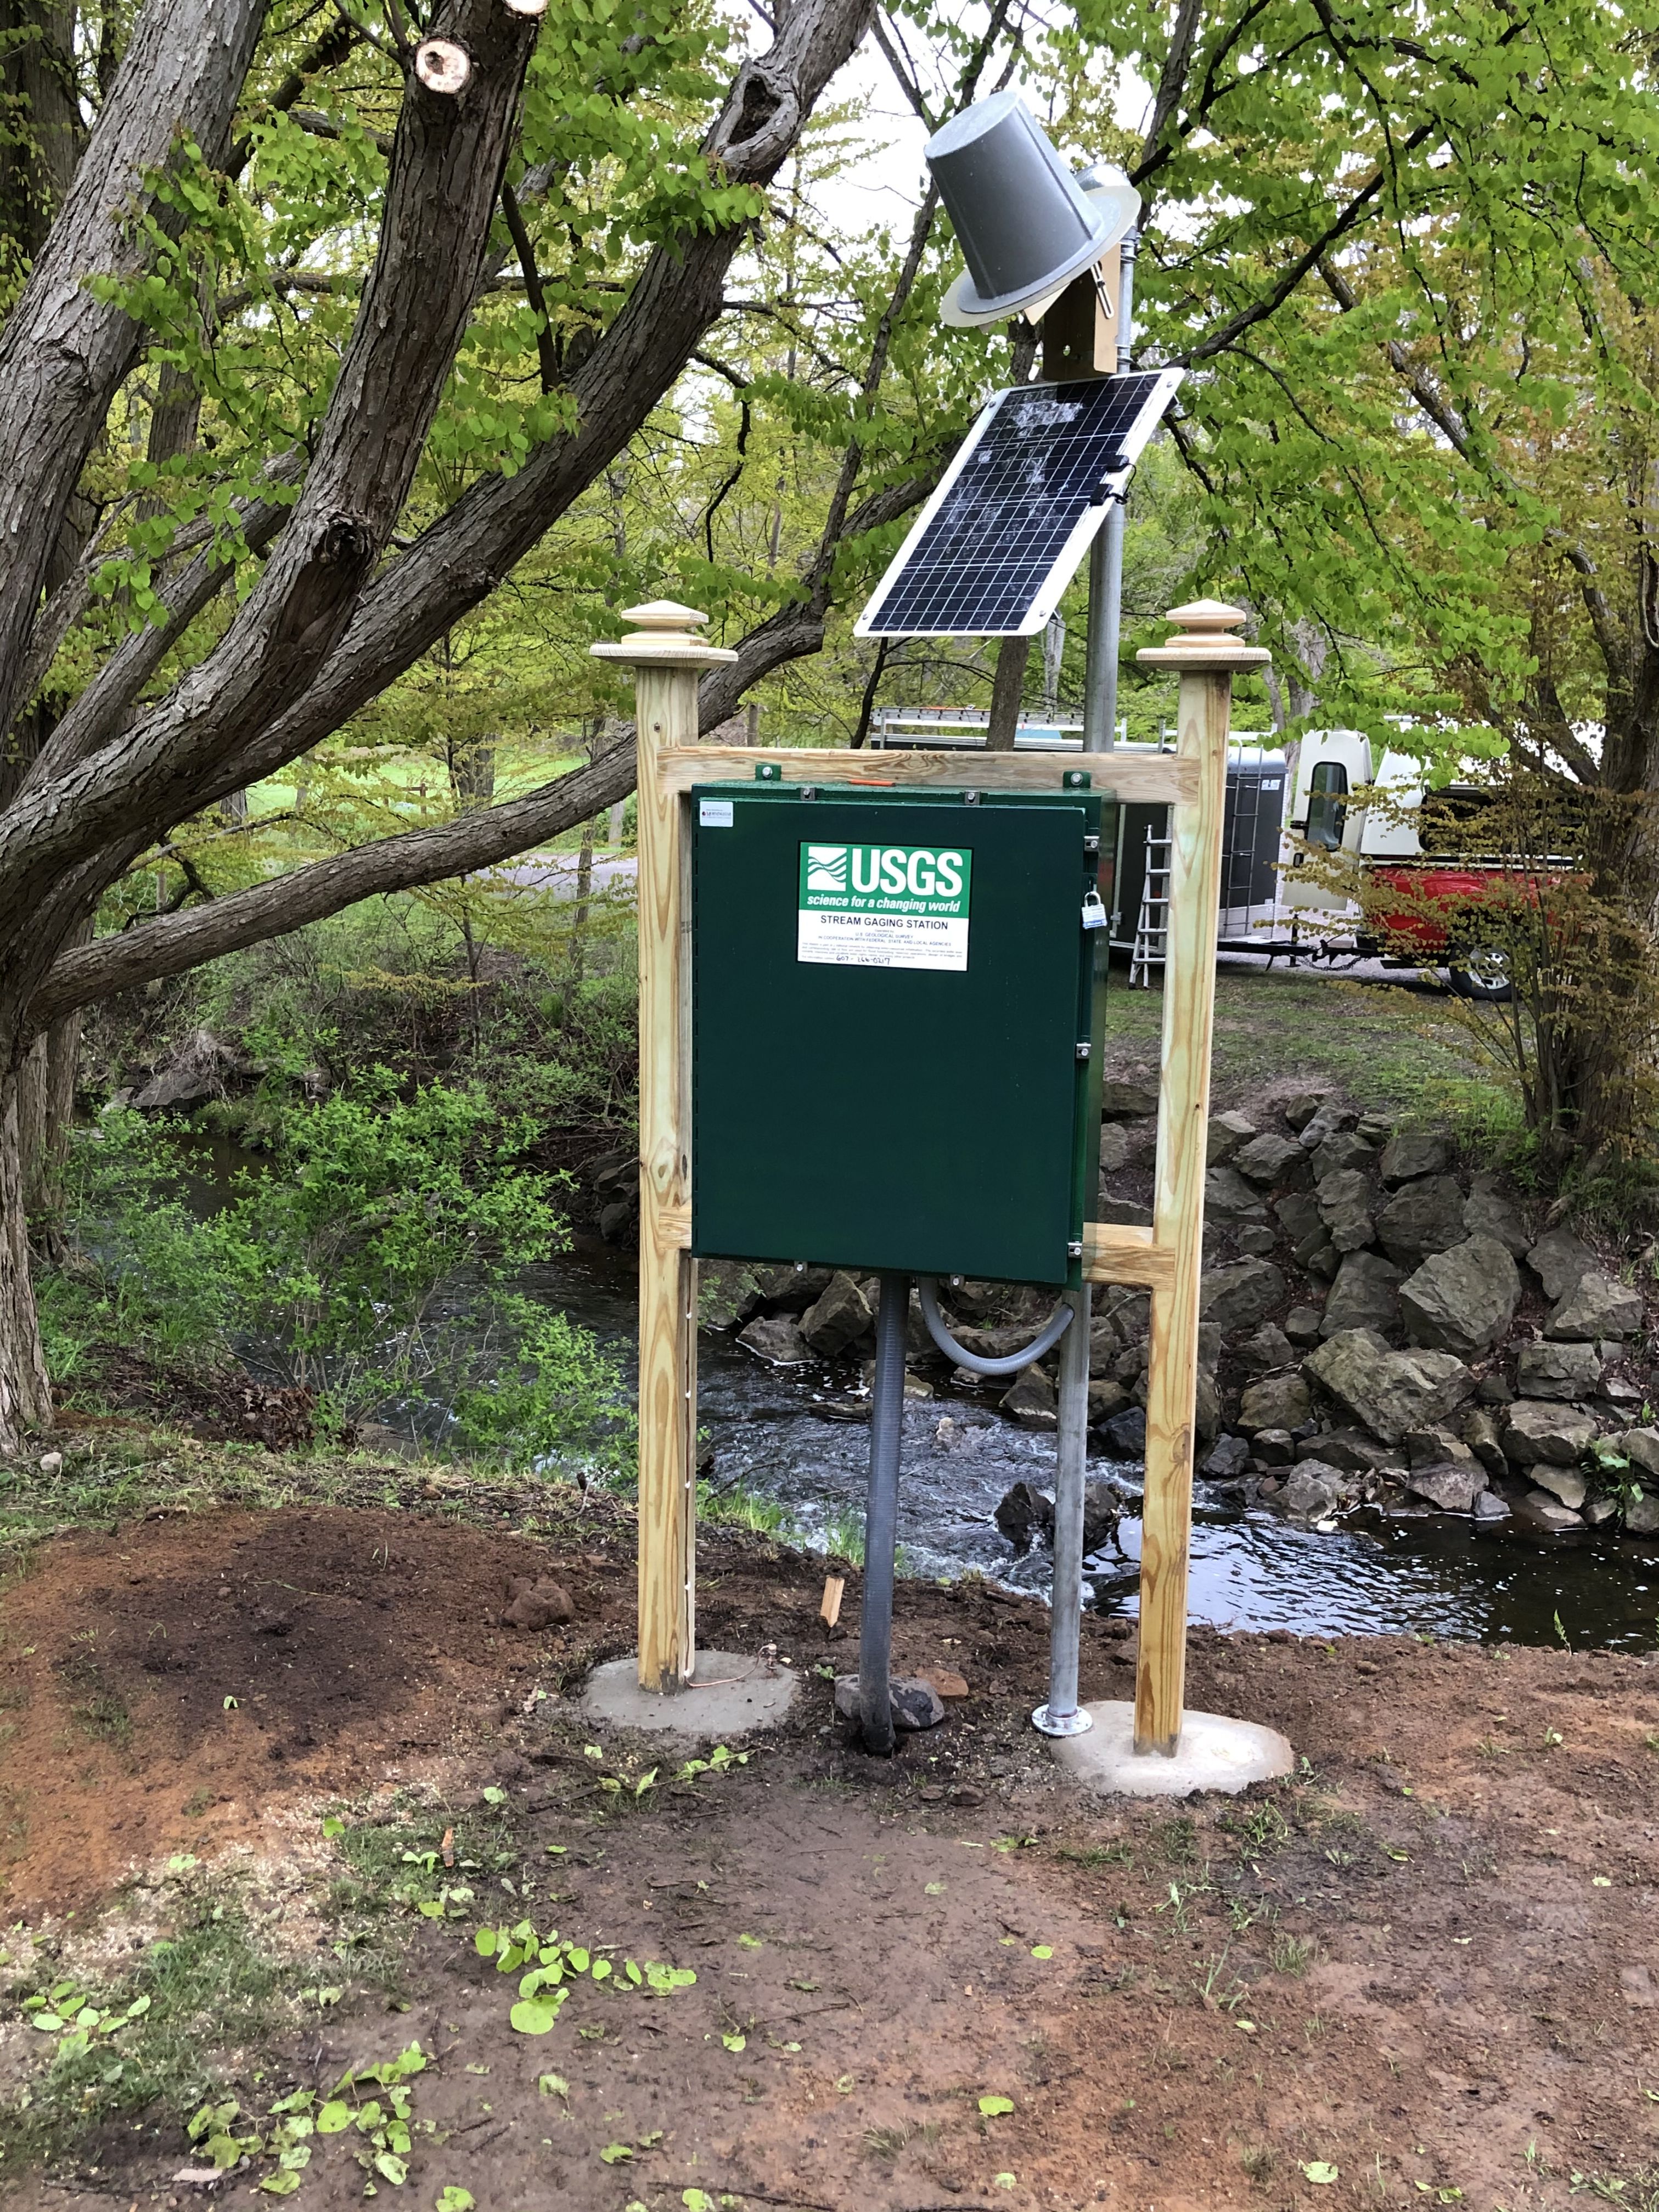 Station image
Summary of all available data for this site
Instantaneous-data availability statement

