PROVISIONAL DATA SUBJECT TO REVISION
Click to hidestation-specific text
Funding for this site is provided by:
 Site Information
LOCATION.--Lat 40°40'43.2", long
73°30'57.1" referenced to North American Datum of
1983, Nassau County, NY, Hydrologic Unit 02030202, on right
bank 40 ft east of intersection of Valentine Place and Old Mill
Road, in Bellmore, 0.5 mi north of Sunrise Highway, and 0.5 mi
northwest of Wantagh.
DRAINAGE AREA.--See REMARKS.
PERIOD OF RECORD.--August 1958 to March 2000, October 2005 to September 2010, October 2012 to September 2013, October 2015 to current year. Records for August 1958 to September 1972 are unpublished and available in files of the Geological Survey.
GAGE.--Since November 1955, daily discharge for 01310000 is calculated based on records for base gage (01309950) and supplementary gage (01309990). Base gage (01309950): Water-stage recorder. Concrete control since July 24, 1974. Datum of gage is 15.06 ft above NGVD of 1929 and 13.89 ft above NAVD of 1988 (VERTCON).
REMARKS.--Subsequent to Nov. 3, 1955, permanent diversion of a substantial portion of the flow through west branch of Bellmore Creek. During high flows, runoff from about 7.8 mi² of the contributing drainage area bypasses the 01309950 gage and contributes to the flow at 01309990. The drainage area for this station is undefined because the degree of connectivity between the two channels of Bellmore Creek varies depending on flow conditions.
Water Years 2016-22: Records fair except those for estimated daily discharges, which are poor.
EXTREMES FOR PERIOD OF RECORD.--Maximum discharge since Oct. 1, 2015, 246 ft³/s, July 9, 2021, gage height, 2.94 ft; minimum discharge since Oct. 1, 2015, 0.13 ft³/s, Sept. 17-19, 2016; minimum gage height since Oct. 1, 2015, 0.97 ft, Sept. 18, 19, 21, 22, 2022. Prior to Oct. 1, 2015, maximum and minimum extremes published in records for 01310000 Bellmore Creek at Bellmore, NY.
 WaterAlert – get an
email or text (SMS) alert based on your chosen threshold.
WaterAlert – get an
email or text (SMS) alert based on your chosen threshold.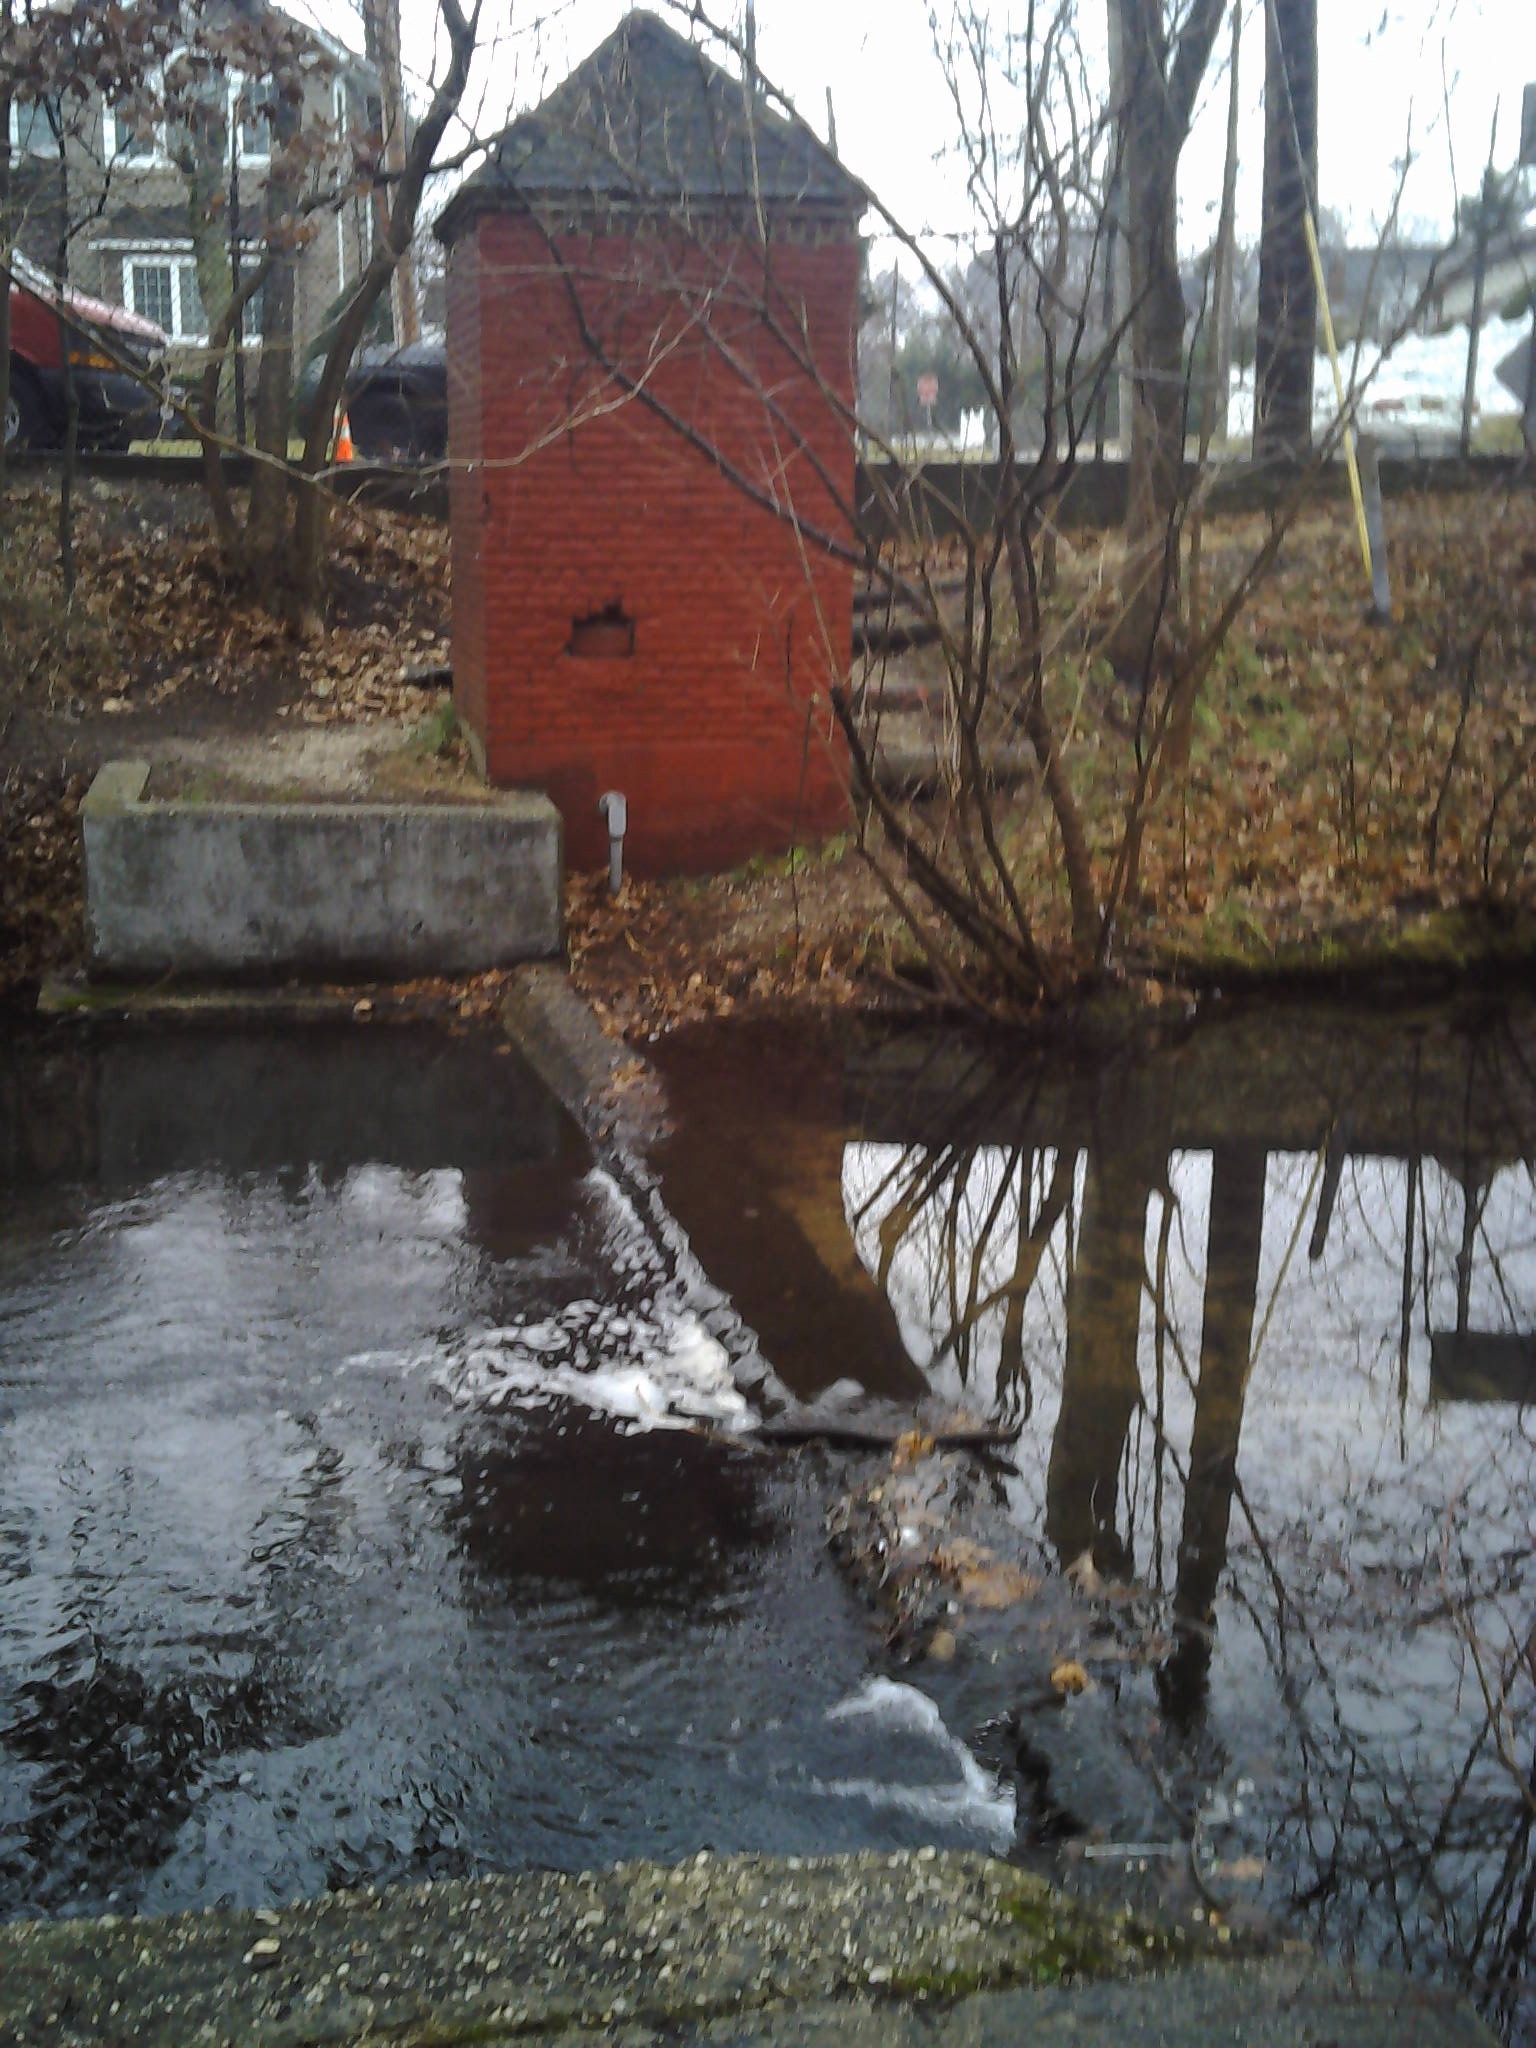 Station image
Summary of all available data for this site
Instantaneous-data availability statement

