PROVISIONAL DATA SUBJECT TO REVISION
Click to hidestation-specific text
Funding for this site is provided by:
 Site Information
LOCATION.--Lat 42°00'52.1", long
74°16'12.7" referenced to North American Datum of
1983, Ulster County, NY, Hydrologic Unit 02020006, on left bank
at downstream side of old bridge abutment on Nissen Road in
Coldbrook, 0.3 mi downstream from Little Beaver Kill, 1.5 mi
upstream from Ashokan Reservoir, and 2.5 mi south of Mount
Tremper.
DRAINAGE AREA.--192 mi².
PERIOD OF RECORD.--January 1914 to September 1925 (monthly discharge only, furnished by State engineer and surveyor of New York, published in WSP 1302), October 1925 to September 1931 (monthly discharge only, furnished by Board of Water Supply, City of New York, published in WSP 1302), October 1931 to current year.
GAGE.--Water-stage recorder and crest-stage gage. Datum of gage is 621.54 ft above NGVD of 1929 and 621.17 ft above NAVD of 1988. Prior to June 15, 1916, nonrecording gage at same site and datum.
REMARKS.--Since 1924, water diverted from Schoharie Reservoir through Shandaken Tunnel (station 01362230) enters Esopus Creek 10.5 mi upstream from station and is included in records of daily discharge. Slight diversion from Beaver Kill into Cooper Lake for water supply of Kingston.
Water Years 2014-23: Records good except those for estimated daily discharges, which are poor.
EXTREMES FOR PERIOD OF RECORD.--Maximum discharge, 75,800 ft³/s, Aug. 28, 2011, gage height, 23.34 ft, outside gage height was 23.75 ft, from crest-stage gage, from rating curve extended above 15,000 ft³/s on basis of slope-area measurements at gage heights 12.39 ft, 15.15 ft, and 20.70 ft; minimum discharge not determined.
PERIOD OF RECORD1.--May 1996 to current year.
PERIOD OF DAILY RECORD1.--WATER TEMPERATURE: May 1996 to September 1998, October 1999 to current year.
TURBIDITY: October 2016 to current year.
SUSPENDED-SEDIMENT: October 2016 to current year.
INSTRUMENTATION1.--A thermistor provides water temperature readings at 15-minute intervals since May 1996. An optical turbidity sensor provides readings at 15-minute intervals since October 2016.
REMARKS1.--Temperature readings prior to Oct. 1, 2007, rounded to nearest 0.5 °C.
Suspended-sediment load and concentration are derived from a regression equation relating turbidity to suspended-sediment concentration.
COOPERATION1.--In cooperation with the New York City Department of Environmental Protection (NYCDEP).
EXTREMES FOR PERIOD OF DAILY RECORD1.--WATER TEMPERATURE: Prior to Oct. 1, 2007--Maximum, 27.0 °C, Aug. 2, 2006; minimum, 0.0 °C on many days during winter periods. After Oct. 1, 2007--Maximum, 28.2 °C, Aug. 8, 2022; minimum, -0.5 °C, Jan. 21, Feb. 29, 2008.
TURBIDITY: Oct. 1, 2016 to June 30, 2022--Maximum, 1410 FNU, June 30, 2017; minimum, <0.2 FNU, Jan. 9, 2020 [<, actual value is known to be less than the value shown].
SUSPENDED-SEDIMENT CONCENTRATION: Maximum 2220 mg/L, June 30, 2017; minimum, 0.3 mg/L, Nov. 12, 13, 14, 2016.
SUSPENDED-SEDIMENT LOAD: Maximum 59,100 tons/day, Oct. 30, 2017; minimum, 0.022 tons/day, Nov. 14, 2016.
1 Water-Quality Records
 WaterAlert – get an
email or text (SMS) alert based on your chosen threshold.
WaterAlert – get an
email or text (SMS) alert based on your chosen threshold.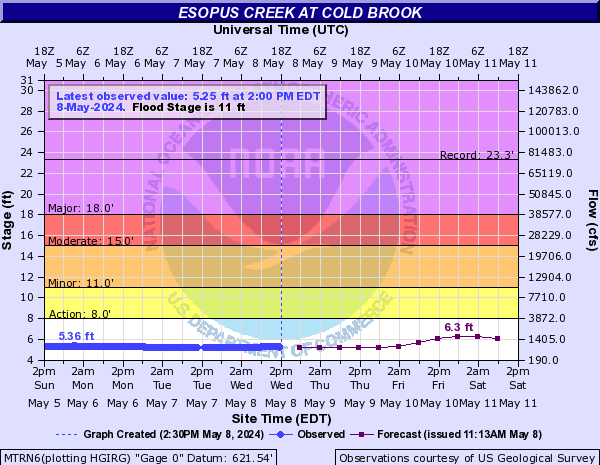
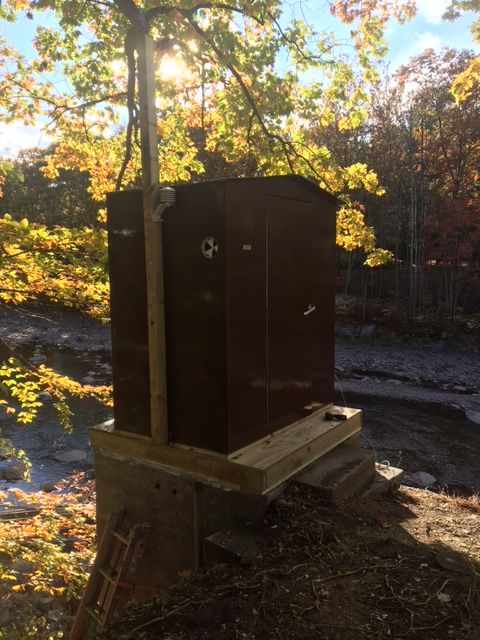 Station image
Summary of all available data for this site
Instantaneous-data availability statement

