PROVISIONAL DATA SUBJECT TO REVISION
Click to hidestation-specific text
Funding for this site is provided by:
 Site Information
LOCATION.--Lat 41°15'58", long
73°39'56" referenced to North American Datum of 1983,
Westchester County, NY, Hydrologic Unit 02030101, on left bank
600 ft downstream from dam on Cross River Reservoir, and 1.5 mi
northeast of Katonah.
DRAINAGE AREA.--29.9 mi².
PERIOD OF RECORD.--March 1994 to current year.
GAGE.--Water-stage recorder and crest-stage gage. Datum of gage is 203.26 ft above NAVD of 1988. Prior to Feb. 8, 1996, at same site at different datum, and Feb. 8, 1996 to Sept. 16, 1998, at site about 0.2 mi downstream at different datum.
REMARKS.--Flow regulated by Cross River Reservoir. Water Years 2014-23: Records good.
EXTREMES FOR PERIOD OF RECORD.--Maximum discharge, 2,070 ft³/s, Mar. 7, 2011, gage height, 7.71 ft; minimum recorded discharge, 0.01 ft³/s, part or all of each day, Oct. 7-9, 14-18, 27-28, Nov. 3-4, 1997, but may have been less during these days; minimum gage height, 1.24 ft, Nov. 17, 1998.
 WaterAlert – get an
email or text (SMS) alert based on your chosen threshold.
WaterAlert – get an
email or text (SMS) alert based on your chosen threshold.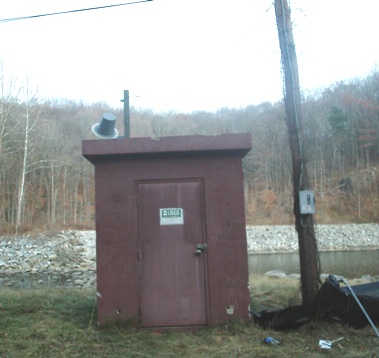 Station image
Summary of all available data for this site
Instantaneous-data availability statement

