PROVISIONAL DATA SUBJECT TO REVISION
Click to hidestation-specific text
Funding for this site is provided by:
 Site Information
LOCATION.--Lat 42°06'22", long
74°43'50" referenced to North American Datum of 1983,
Delaware County, NY, Hydrologic Unit 02040102, on left bank 0.4
mi upstream from bridge on New York City Road 9 and Pepacton
Reservoir, and 2.7 mi southwest of Dunraven.
DRAINAGE AREA.--25.2 mi².
PERIOD OF RECORD.--February 1937 to current year. Published as "at Arena" 1937-67.
REVISIONS HISTORY.--WSP 1432: 1937. WDR NY-82-1: Drainage area. WDR NY-84-1: 1979-83.
GAGE.--Water-stage recorder and crest-stage gage. Datum of gage is 1,298.54 ft Board of Water Supply, City of New York datum and 1,297.18 ft above NAVD of 1988. Prior to Oct. 17, 1939, nonrecording gage at site 0.2 mi downstream at different datum. Oct. 17 to Dec. 8, 1939, nonrecording gage at present site at different datum.
REMARKS.--Water Years 2014-24: Records fair except those for estimated daily discharges and those above 500 ft³/s, which are poor.
EXTREMES FOR PERIOD OF RECORD.--Maximum discharge, 5,380 ft³/s, Jan. 19, 1996, gage height, 12.56 ft, from rating curve extended above 1,300 ft³/s on basis of flow-through-culvert measurement of peak flow; minimum discharge observed, 1.2 ft³/s, Sept. 25, 26, 1939.
PERIOD OF DAILY RECORD1.--WATER TEMPERATURE: October 2019 to September 2024. SPECIFIC CONDUCTANCE: October 2019 to September 2024.
INSTRUMENTATION1.--A continuous water-quality monitor with water temperature and specific conductance provides 15-minute-interval readings.
EXTREMES FOR PERIOD OF DAILY RECORD1.--SPECIFIC CONDUCTANCE: Maximum, 94 uS/cm at 25 °C, Nov. 5, 6, 2019; minimum, 20 uS/cm at 25 °C, Oct. 26, 2021. WATER TEMPERATURE: Maximum, 23.9 °C, Aug. 8, 2022, July 16, 2024; minimum, -0.1 °C, Feb. 18, 19, 20, 2022, Dec. 24, 2022, several days during the 2024 winter period.
1 Water-Quality Records
 WaterAlert – get an
email or text (SMS) alert based on your chosen threshold.
WaterAlert – get an
email or text (SMS) alert based on your chosen threshold.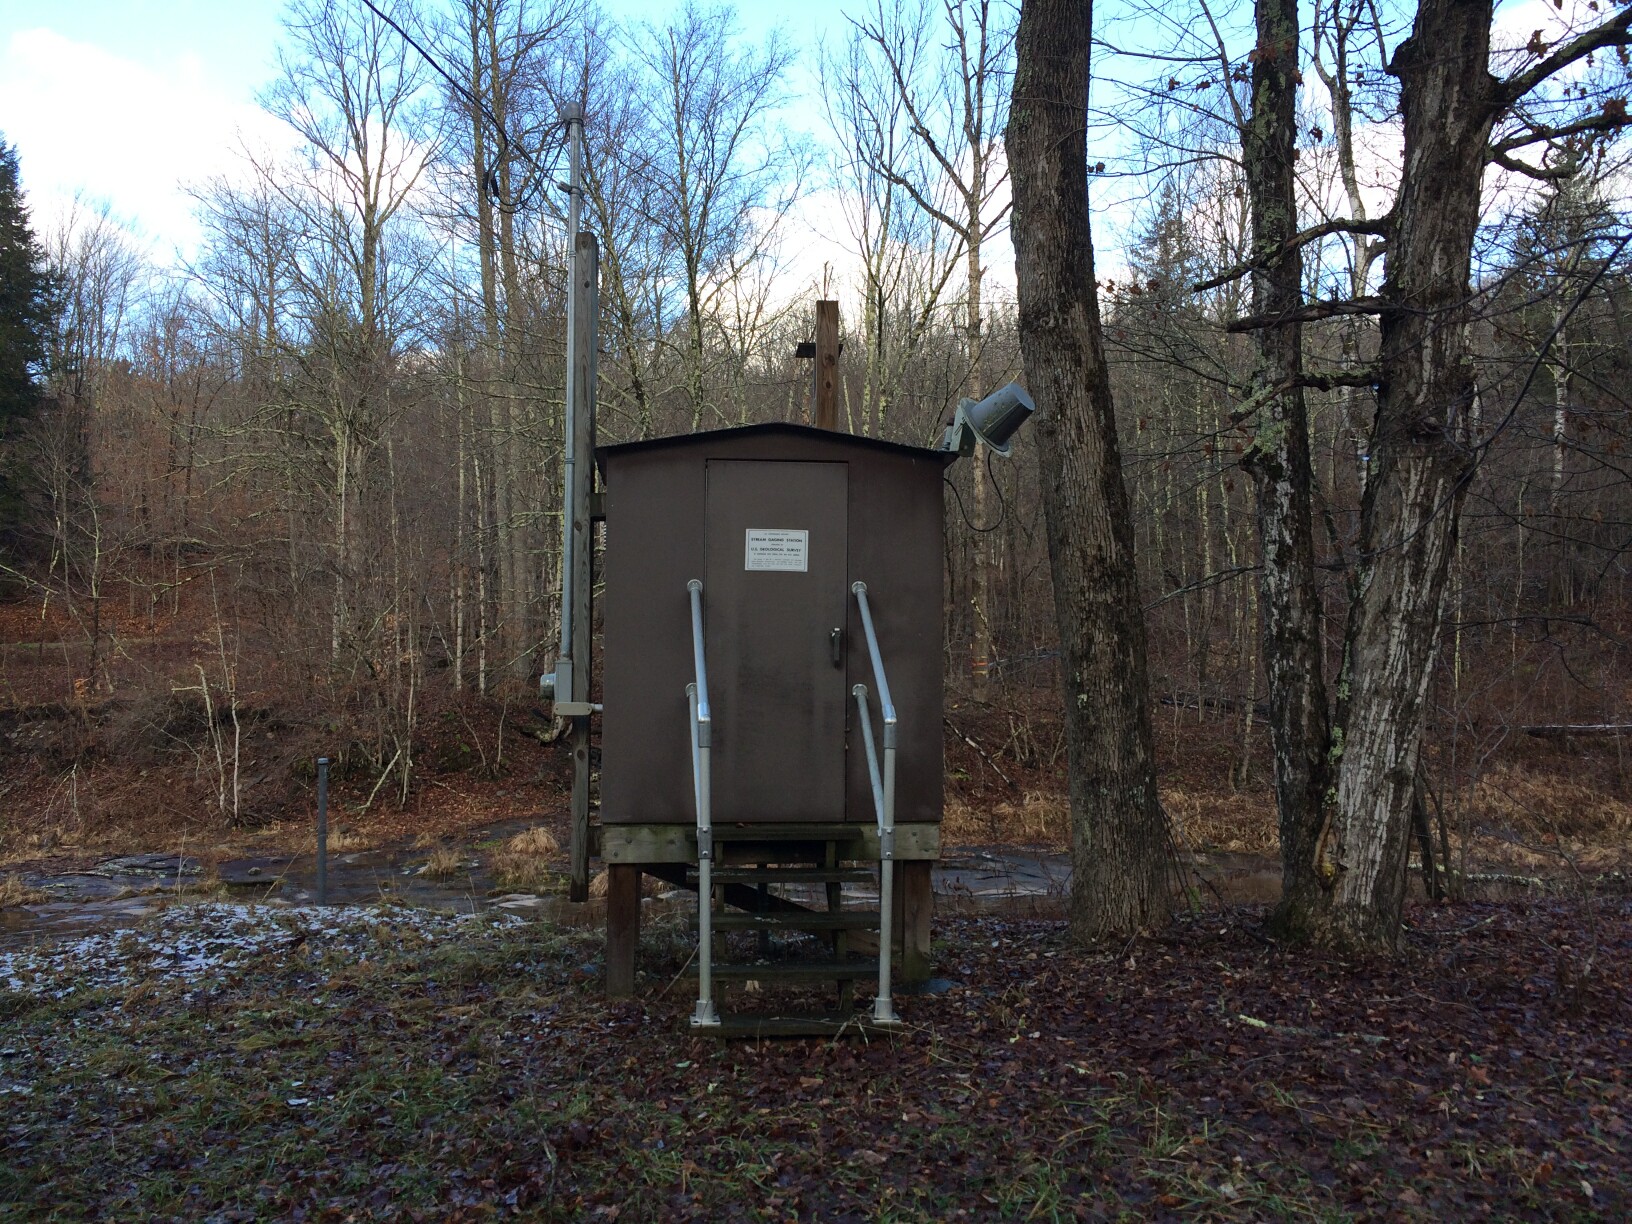 Station image
Summary of all available data for this site
Instantaneous-data availability statement

