PROVISIONAL DATA SUBJECT TO REVISION
Click to hidestation-specific text
Funding for this site is provided by:
 Site Information
LOCATION.--Lat 42°09'58.0", long
75°08'24.1" referenced to North American Datum of
1983, Delaware County, NY, Hydrologic Unit 02040101, on left
bank at west end of fairgrounds at Walton, and 100 ft
downstream from West Brook.
DRAINAGE AREA.--332 mi².
PERIOD OF RECORD.--October 1950 to current year.
REVISIONS HISTORY.--WDR NY-82-1: Drainage area. Datum of gage was revised on Oct. 6. 2022, from 1,190.30 ft to 1,188.21 ft above NGVD of 1929 and from 1,189.88 ft to 1,187.77 ft above NAVD of 1988, based on an updated geodetic survey and correction of the original levels.
GAGE.--Water-stage recorder and crest-stage gage. Datum of gage is 1,188.21 ft above NGVD of 1929 and 1,187.77 ft above NAVD of 1988.
REMARKS.--Water Years 2014-15: Records good except those for estimated daily discharges, which are poor.
Water Years 2016-17: Records fair except those for estimated daily discharges, which are poor.
Water Years 2018-19: Records poor.
Water Years 2020-21: Records good except those for estimated daily discharges, which are poor.
Water Years 2022-23: Records good except those above 4,000 ft³/s, which are fair, and those for estimated daily discharges, which are poor.
EXTREMES FOR PERIOD OF RECORD.--Maximum discharge, 28,600 ft³/s, June 28, 2006, gage height, 16.85 ft, outside gage height was 17.10 ft, from crest-stage gage; minimum discharge, 12 ft³/s, Sept. 15, Nov. 22, 1964; minimum gage height, 1.86 ft, Nov. 22, 1964.
PERIOD OF DAILY RECORD1.--WATER TEMPERATURE: October 2018 to current year. SPECIFIC CONDUCTANCE: October 2019 to current year.
INSTRUMENTATION1.--A continuous water-quality monitor with water temperature and specific conductance provides 15-minute-interval readings.
EXTREMES FOR PERIOD OF DAILY RECORD1.--WATER TEMPERATURE: Maximum, 33.2°C, July 20, 2022, but may have been higher during period of instrument malfunction; minimum, -0.1°C on several days during 2020 winter period and Feb. 16, 2022, but may have been lower during period of instrument malfunction. SPECIFIC CONDUCTANCE: Maximum, 227 uS/cm at 25 °C, Feb. 4, 2022; minimum, 44 uS/cm at 25 °C, Dec. 25, 2020.
1 Water-Quality Records
 WaterAlert – get an
email or text (SMS) alert based on your chosen threshold.
WaterAlert – get an
email or text (SMS) alert based on your chosen threshold.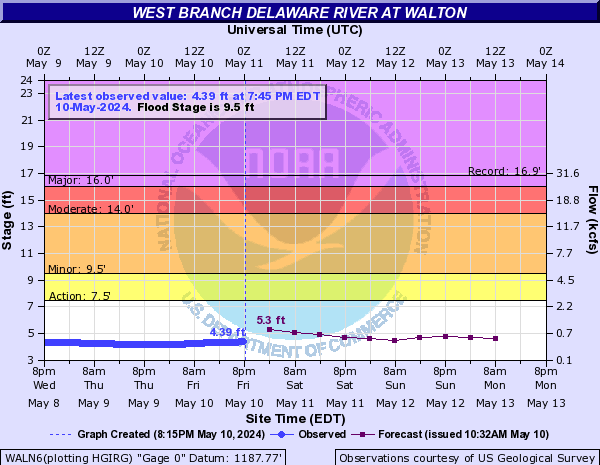
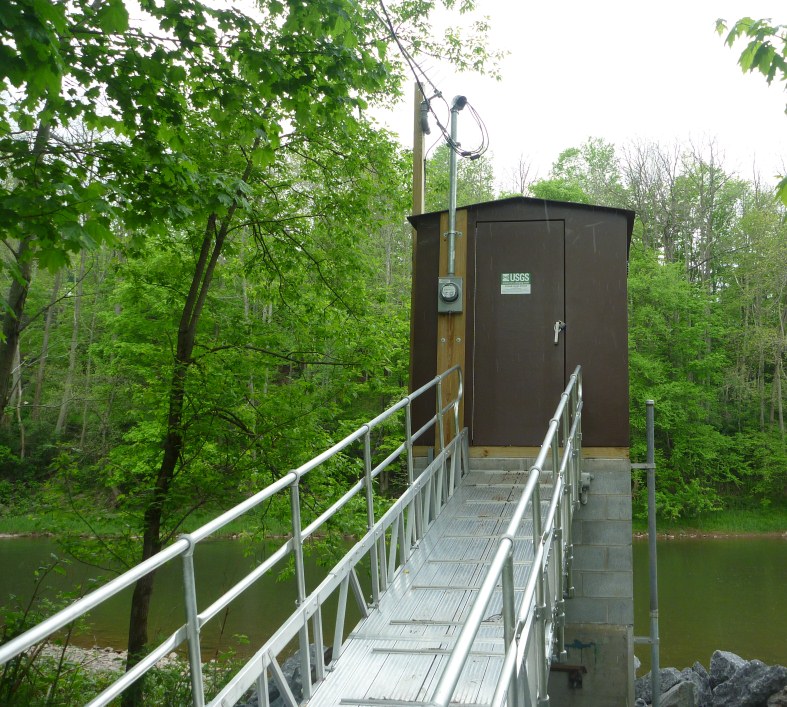 Station image
Summary of all available data for this site
Instantaneous-data availability statement

