PROVISIONAL DATA SUBJECT TO REVISION
Click to hidestation-specific text
Funding for this site is provided by:
 Site Information
LOCATION.--Lat 43°01'40.2", long
77°28'43.4" referenced to North American Datum of
1983, Ontario County, NY, Hydrologic Unit 04140101, on right
bank 90 ft upstream from bridge on Railroad Mills Road, 1.5 mi
northwest of Fishers, and 4.0 mi southwest of Fairport.
DRAINAGE AREA.--39.2 mi².
PERIOD OF RECORD.--July 1991 to September 2010, May 2015 to current year.
GAGE.--Water-stage recorder and crest-stage gage. Datum of gage is 443.50 ft above NAVD of 1988.
COOPERATION.--Operated in cooperation with the Monroe County Department Health.
REMARKS.--Unpublished water-quality records for prior years are available in files of Monroe County Department of Health.
Water Years 2015-18: Records good except those for estimated daily discharges, which are fair. Water Years 2019-23: Records good except those for estimated daily discharges, which are poor.
EXTREMES FOR PERIOD OF RECORD.--Maximum discharge, 1,000 ft³/s, Jan. 8, 1998, gage height 10.4 ft, from floodmarks; minimum discharge, 6.8 ft³/s, Aug. 21, 1995, gage height, 3.96 ft.
PERIOD OF DAILY RECORD1.--WATER TEMPERATURES: February 1995 to September 2010.
EXTREMES FOR PERIOD OF DAILY RECORD1.--WATER TEMPERATURES: Maximum, 23.4°C, July 3, 2002, July 20, 2006; minimum, 0.0°C, on many days during winter period.
1 Water-Quality Records
 WaterAlert – get an
email or text (SMS) alert based on your chosen threshold.
WaterAlert – get an
email or text (SMS) alert based on your chosen threshold.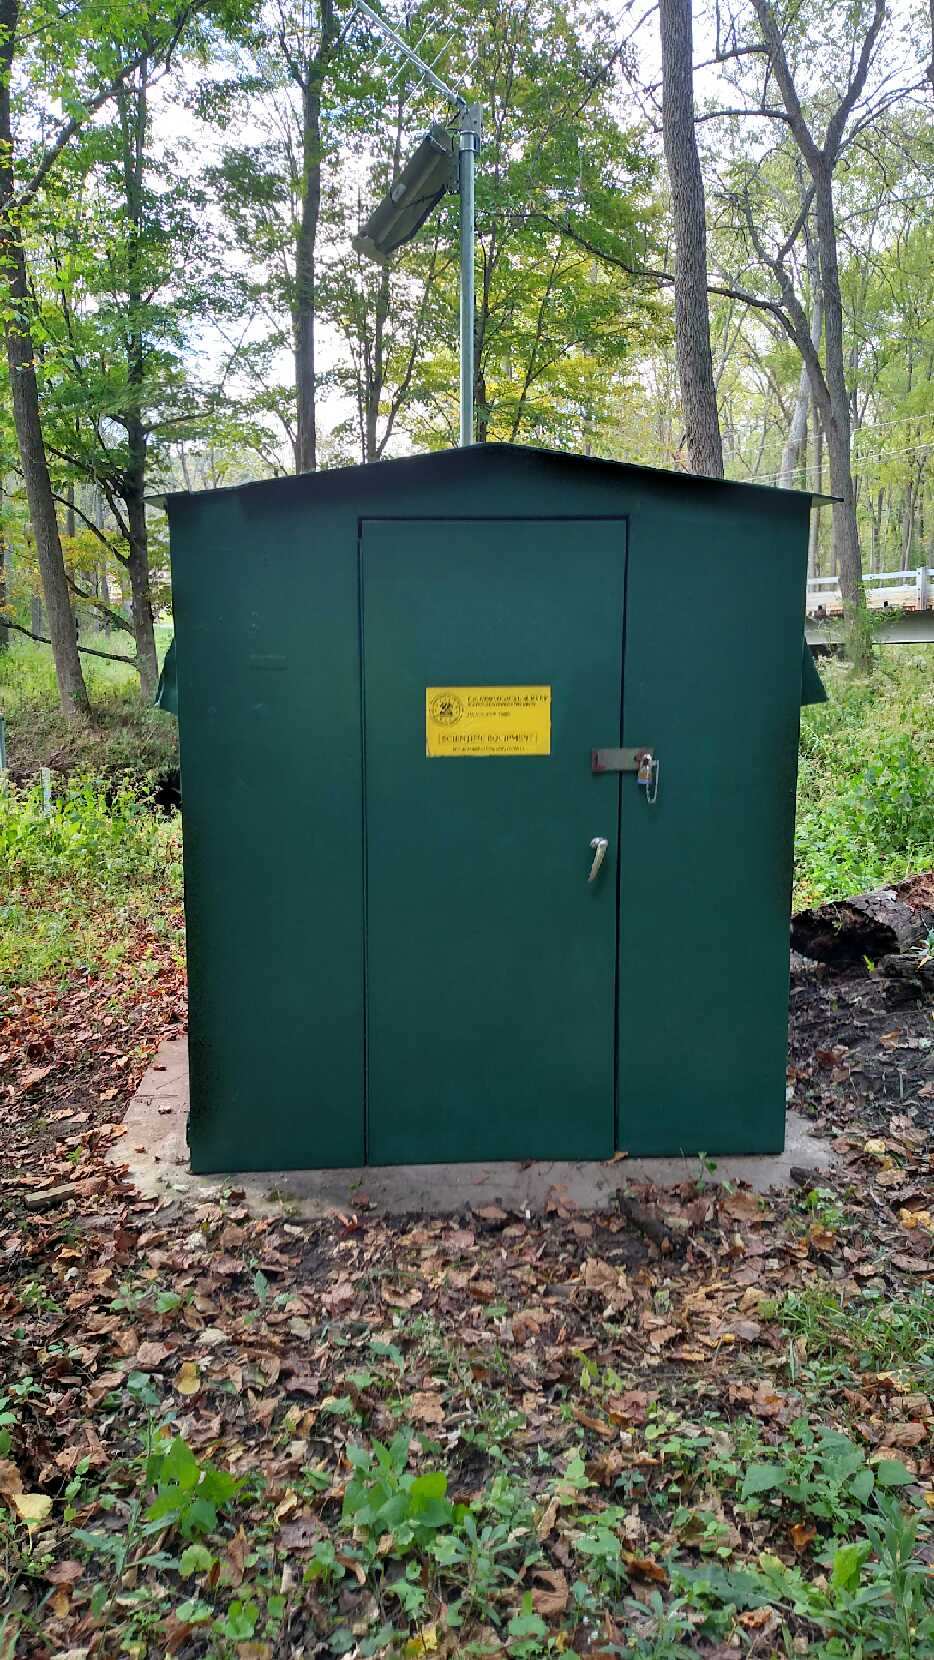 Station image
Summary of all available data for this site
Instantaneous-data availability statement

