PROVISIONAL DATA SUBJECT TO REVISION
Click to hidestation-specific text
Funding for this site is provided by:
 Site Information
LOCATION.--Lat 43°31'52.3", long
76°02'15.7" referenced to North American Datum of
1983, Oswego County, NY, Hydrologic Unit 04140102, on right
bank 30 ft downstream from County Highway 48 in Pineville, 0.8
mi upstream from Trout Brook, and 2.3 mi northwest of
Altmar.
DRAINAGE AREA.--238 mi².
PERIOD OF RECORD.--November 1992 to current year.
GAGE.--Water-stage recorder and crest-stage gage. Datum of gage is 477.54 ft above NGVD of 1929 and 475.35 ft above NAVD of 1988.
REMARKS.--Seasonal regulation of flow by Salmon River Reservoir at Redfield. Extensive diurnal fluctuation caused by powerplants at Bennett Bridge and Lighthouse Hill.
Water Years 2014-23: Records good except those for estimated daily discharges, which are fair.
EXTREMES FOR PERIOD OF RECORD.--Maximum discharge, 17,000 ft³/s, Oct. 1, 2010, gage height, 14.30 ft, from rating curve extended above 8,500 ft³/s on basis of contracted-opening measurement at gage height 16.36 ft; minimum discharge not determined.
EXTREMES OUTSIDE PERIOD OF RECORD.--Flood of Dec. 29, 1984, reached a stage of 16.36 ft, from floodmarks, discharge, 24,800 ft³/s, on basis of contracted-opening measurement of peak flow.
 WaterAlert – get an
email or text (SMS) alert based on your chosen threshold.
WaterAlert – get an
email or text (SMS) alert based on your chosen threshold.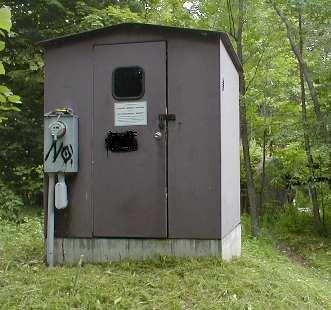 Station image
Summary of all available data for this site
Instantaneous-data availability statement

