PROVISIONAL DATA SUBJECT TO REVISION
Click to hidestation-specific text
Funding for this site is provided by:
 Site Information
LOCATION.--Lat 42°27'48.4", long
78°56'04.3" referenced to North American Datum of
1983, Erie County, NY, Hydrologic Unit 04120102, on right bank
15 ft upstream from bridge on State Highways 39 and 62 at
Gowanda, 4.2 mi downstream from South Branch, and 17.8 mi
upstream from mouth.
DRAINAGE AREA.--436 mi².
PERIOD OF RECORD.--November 1939 to March 1998, April to September 1998 (annual maximum only), October 1999 to current year.
REVISIONS HISTORY.--WSP 2112: Datum. WDR NY-71-1: 1956 (M). WDR NY-74-1: 1940-42 (P). WDR NY-82-3: Drainage area. WDR-US-2009: 1990-98 (P), 2000-08 (P).
GAGE.--Water-stage recorder. Datum of gage is 738.85 ft above NGVD of 1929 and 738.36 ft above NAVD of 1988. Prior to May 29, 2011, at site 380 ft downstream at same datum.
REMARKS.--Prior to 1998, diurnal fluctuation at low and medium flows caused by powerplant 20 mi upstream from station.
Water Years 2014-23: Records good except those for estimated daily discharges, which are fair.
EXTREMES FOR PERIOD OF RECORD.--Maximum discharge, 34,600 ft³/s, Mar. 7, 1956, gage height, 14.14 ft, site then in use; minimum discharge, about 6 ft³/s, Aug. 21, 1941, result of regulation; minimum gage height, 0.90 ft, Oct. 26, 1951, site then in use.
PERIOD OF DAILY RECORD1.-- WATER TEMPERATURE: June 2011 to current year. SPECIFIC CONDUCTANCE: June 2011 to current year. pH: June 2011 to current year. DISSOLVED OXYGEN: June 2011 to current year. TURBIDITY: June 2011 to current year.
INSTRUMENTATION1.--Refrigerated automatic sampler since June 2011. Multi-parameter water-quality sonde measures water temperature, specific conductance, pH, dissolved oxygen, and turbidity at 15-minute intervals since June 2011.
COOPERATION1.--In cooperation with the U.S. Environmental Protection Agency's Great Lakes Restoration Initiative (GLRI).
EXTREMES FOR PERIOD OF DAILY RECORD1.--
WATER TEMPERATURE: Maximum, 33.0°C, July 22, 2011; minimum, -0.1°C, on several days.
SPECIFIC CONDUCTANCE: Maximum, 645 uS/cm @ 25°C, Mar. 12, 2015; minimum, 122 uS/cm @ 25°C, Oct. 28, 29, 2011.
pH: Maximum, 8.9, Apr. 29, 30, May 1, 2013, Apr. 9, 10, 15, 16, 17, 2016; minimum, 7.6, Oct. 21, 2020.
DISSOLVED OXYGEN: Maximum, 15.4 mg/L, Jan. 5, 2016; minimum, 6.7 mg/L, July 17, 2012.
TURBIDITY: June 1, 2011 to June 6, 2016: Maximum, >1,380 FNU, on several days; minimum, 3.0 FNU, Aug. 21, 22, 2013. June 7, 2016 to current year: Maximum, >4,000 FNU, Sept. 14, 2017, June 1, 2018; minimum, 2.0 FNU, Oct. 2, 2017. [>, actual value is known to be greater than the value shown]
1 Water-Quality Records
 WaterAlert – get an
email or text (SMS) alert based on your chosen threshold.
WaterAlert – get an
email or text (SMS) alert based on your chosen threshold.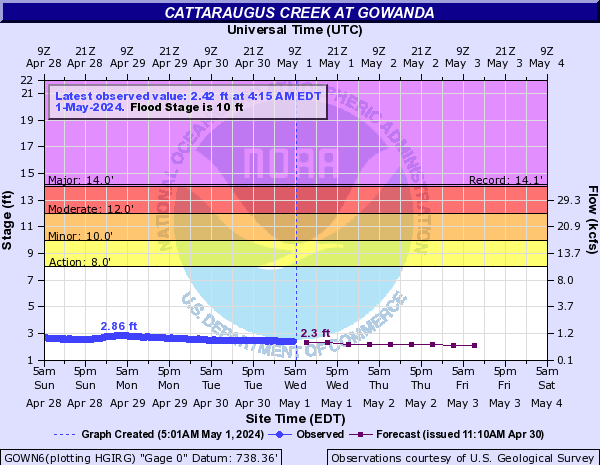
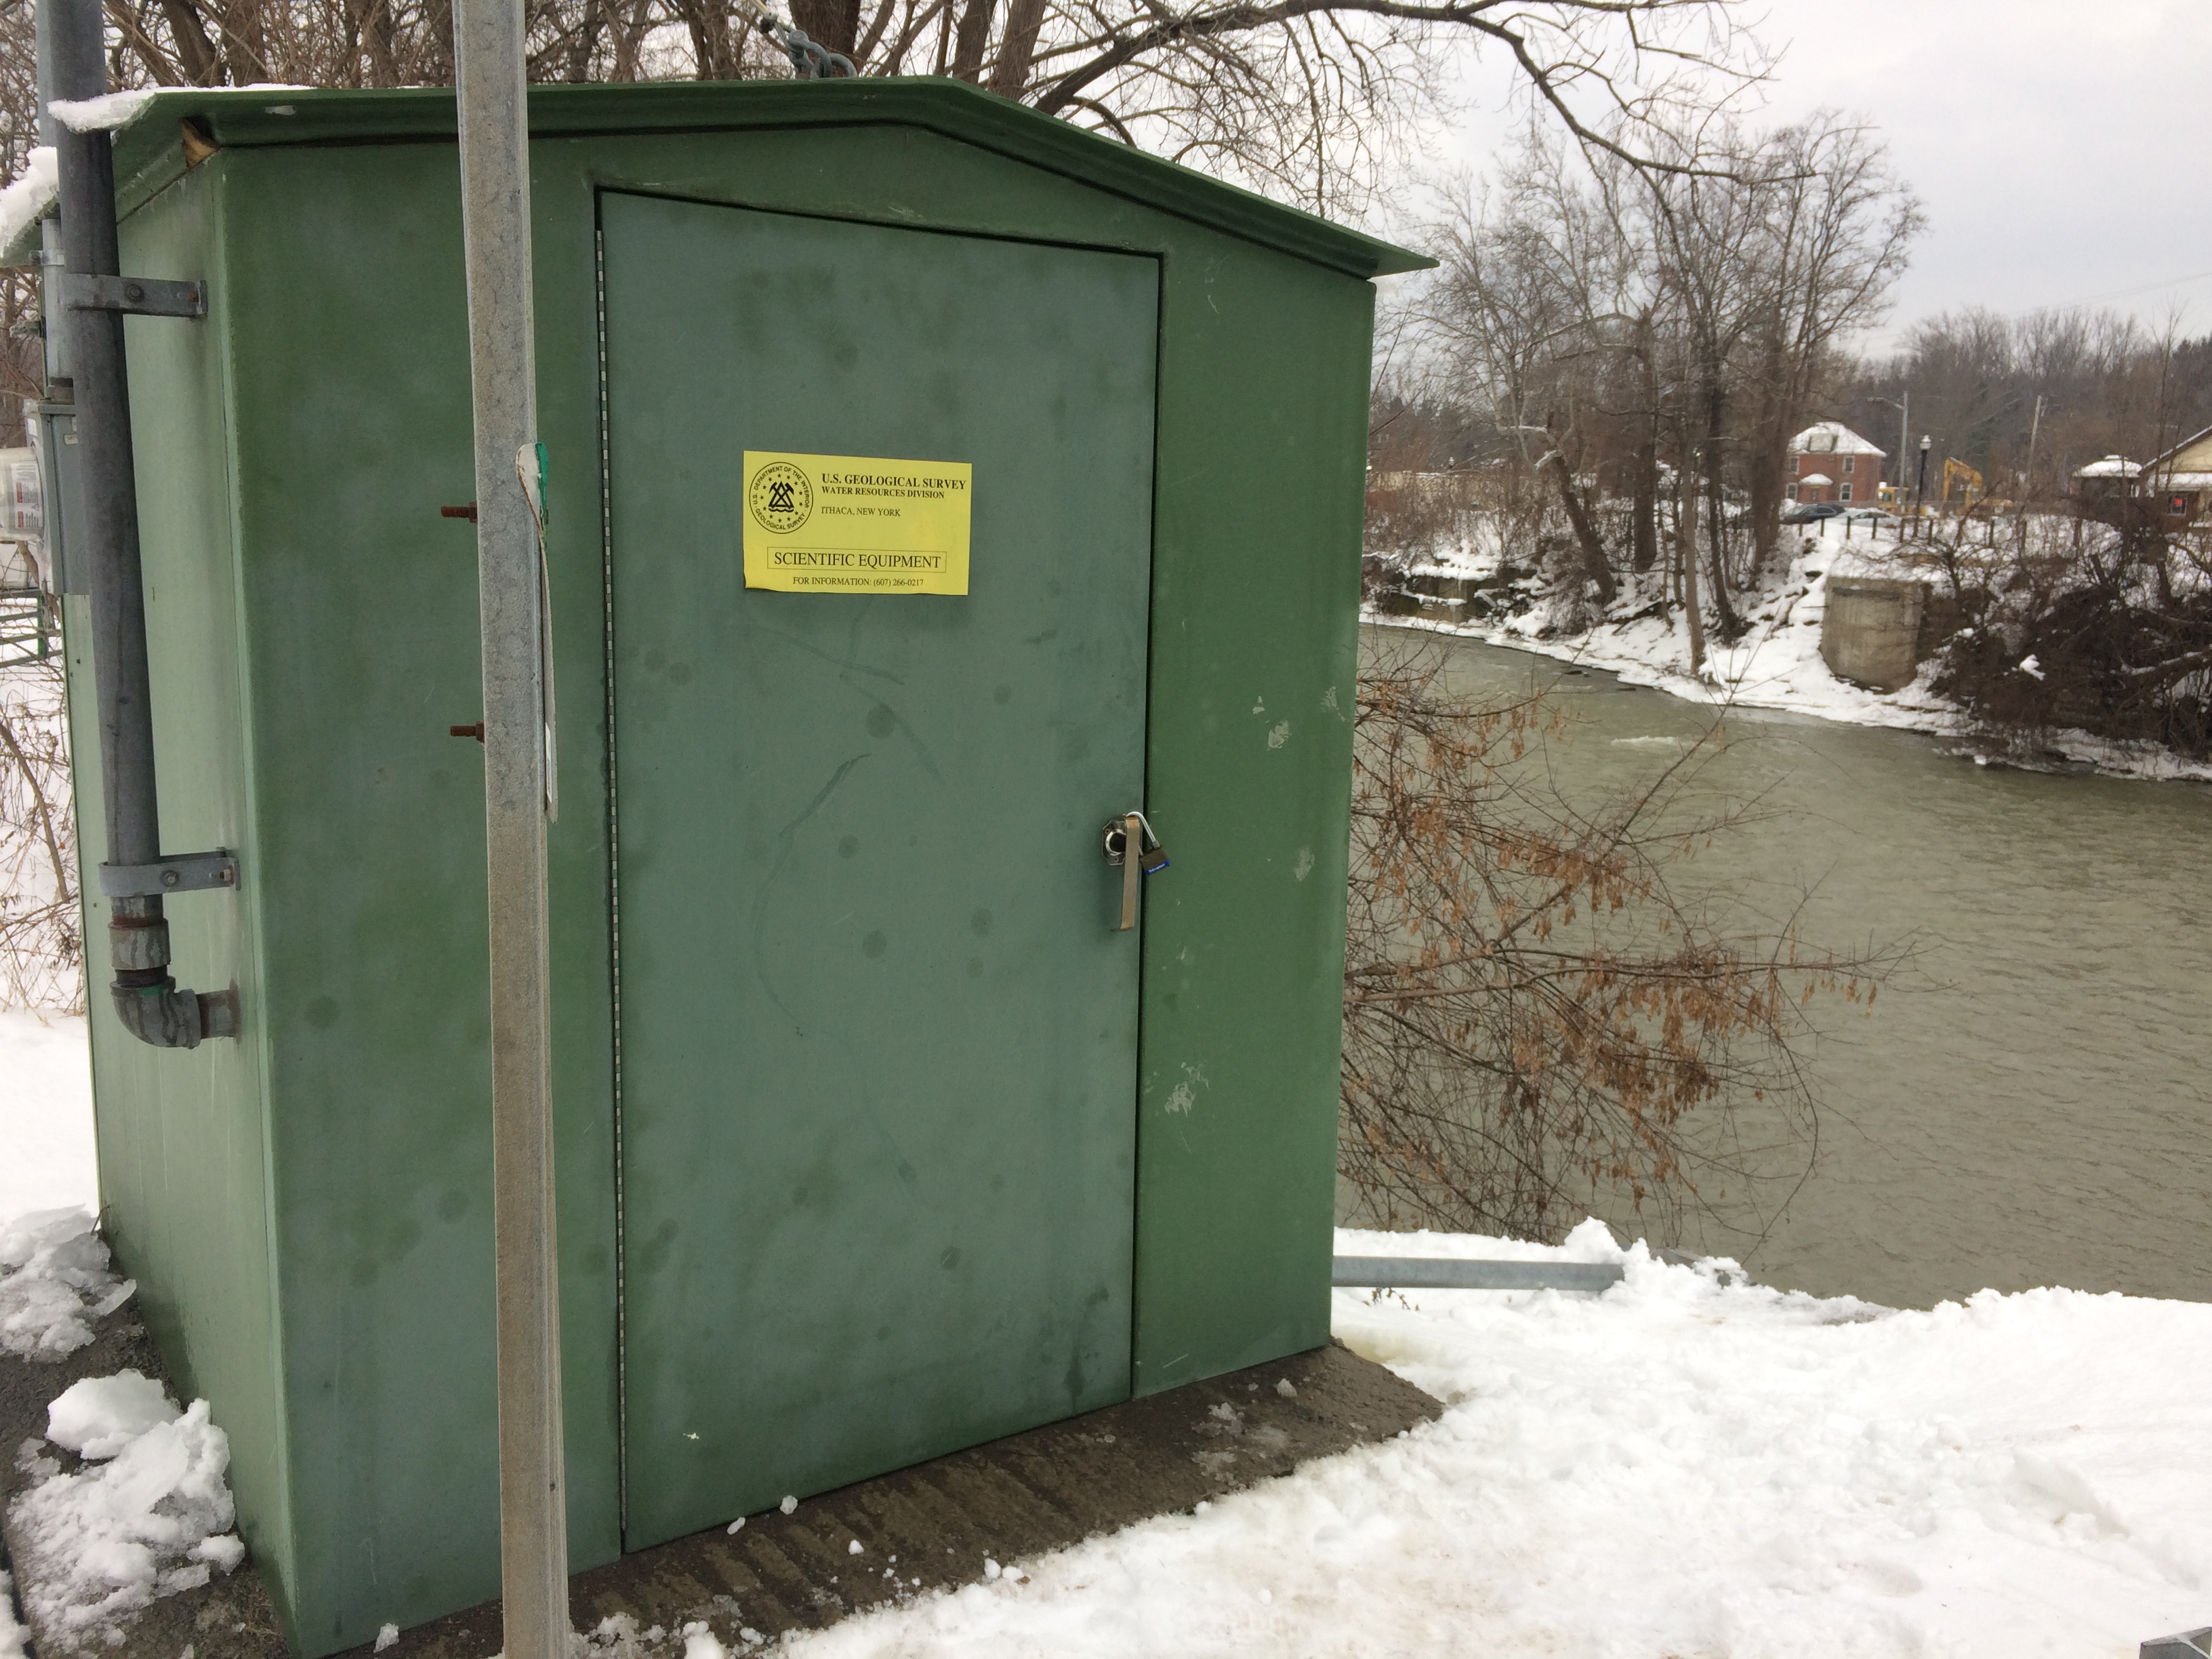 Station image
Summary of all available data for this site
Instantaneous-data availability statement


