PROVISIONAL DATA SUBJECT TO REVISION
Click to hidestation-specific text
The 15-minute precipitation data for this
station are temporary and will only be displayed for 120 days.
Although the instrumentation is calibrated at least once/year, the
temporary classification means that documented routine inspections and
other quality assurance measures are not performed that would make the
data acceptable for archival, retrieval, or future use in general
scientific or interpretive studies.
 Site Information
Funding for this site is provided by:
Site Information
LOCATION.--Lat 42°44'33.6", long
78°08'15.4" referenced to North American Datum of
1983, Wyoming County, NY, Hydrologic Unit 04130003,
on left bank on upstream side of bridge on Court
Street at Warsaw.
DRAINAGE AREA.--39.5 mi². (Area at site used prior to Oct. 1, 2019, 39.7 mi², revised.)
PERIOD OF RECORD.--December 1963 to current year.
REVISIONS HISTORY.--WDR NY-82-3: Drainage area. Drainage area for the period prior to Oct. 1, 2019, was revised on Apr. 29, 2020, based on improved watershed delineation methods.
GAGE.--Water-stage recorder. Datum of gage is 987.15 ft above NGVD of 1929 (levels by Corps of Engineers) and 986.66 ft above NAVD of 1988. Prior to Oct. 1, 2019, at site 730 ft downstream at same datum.
REMARKS.--Water Years 2014-15: Records good except those for estimated daily discharges, which are fair.
Water Years 2016-19: Records fair except those for estimated daily discharges and those below 100 ft³/s, which are poor.
Water Years 2020-23: Records good except those for estimated daily discharges, which are poor.
EXTREMES FOR PERIOD OF RECORD.--Maximum discharge, 4,110 ft³/s, July 8, 1998, gage height 9.90 ft, site then in use; minimum discharge, 0.87 ft³/s, Sept. 28, 2007, site then in use.
 WaterAlert – get an
email or text (SMS) alert based on your chosen threshold.
WaterAlert – get an
email or text (SMS) alert based on your chosen threshold.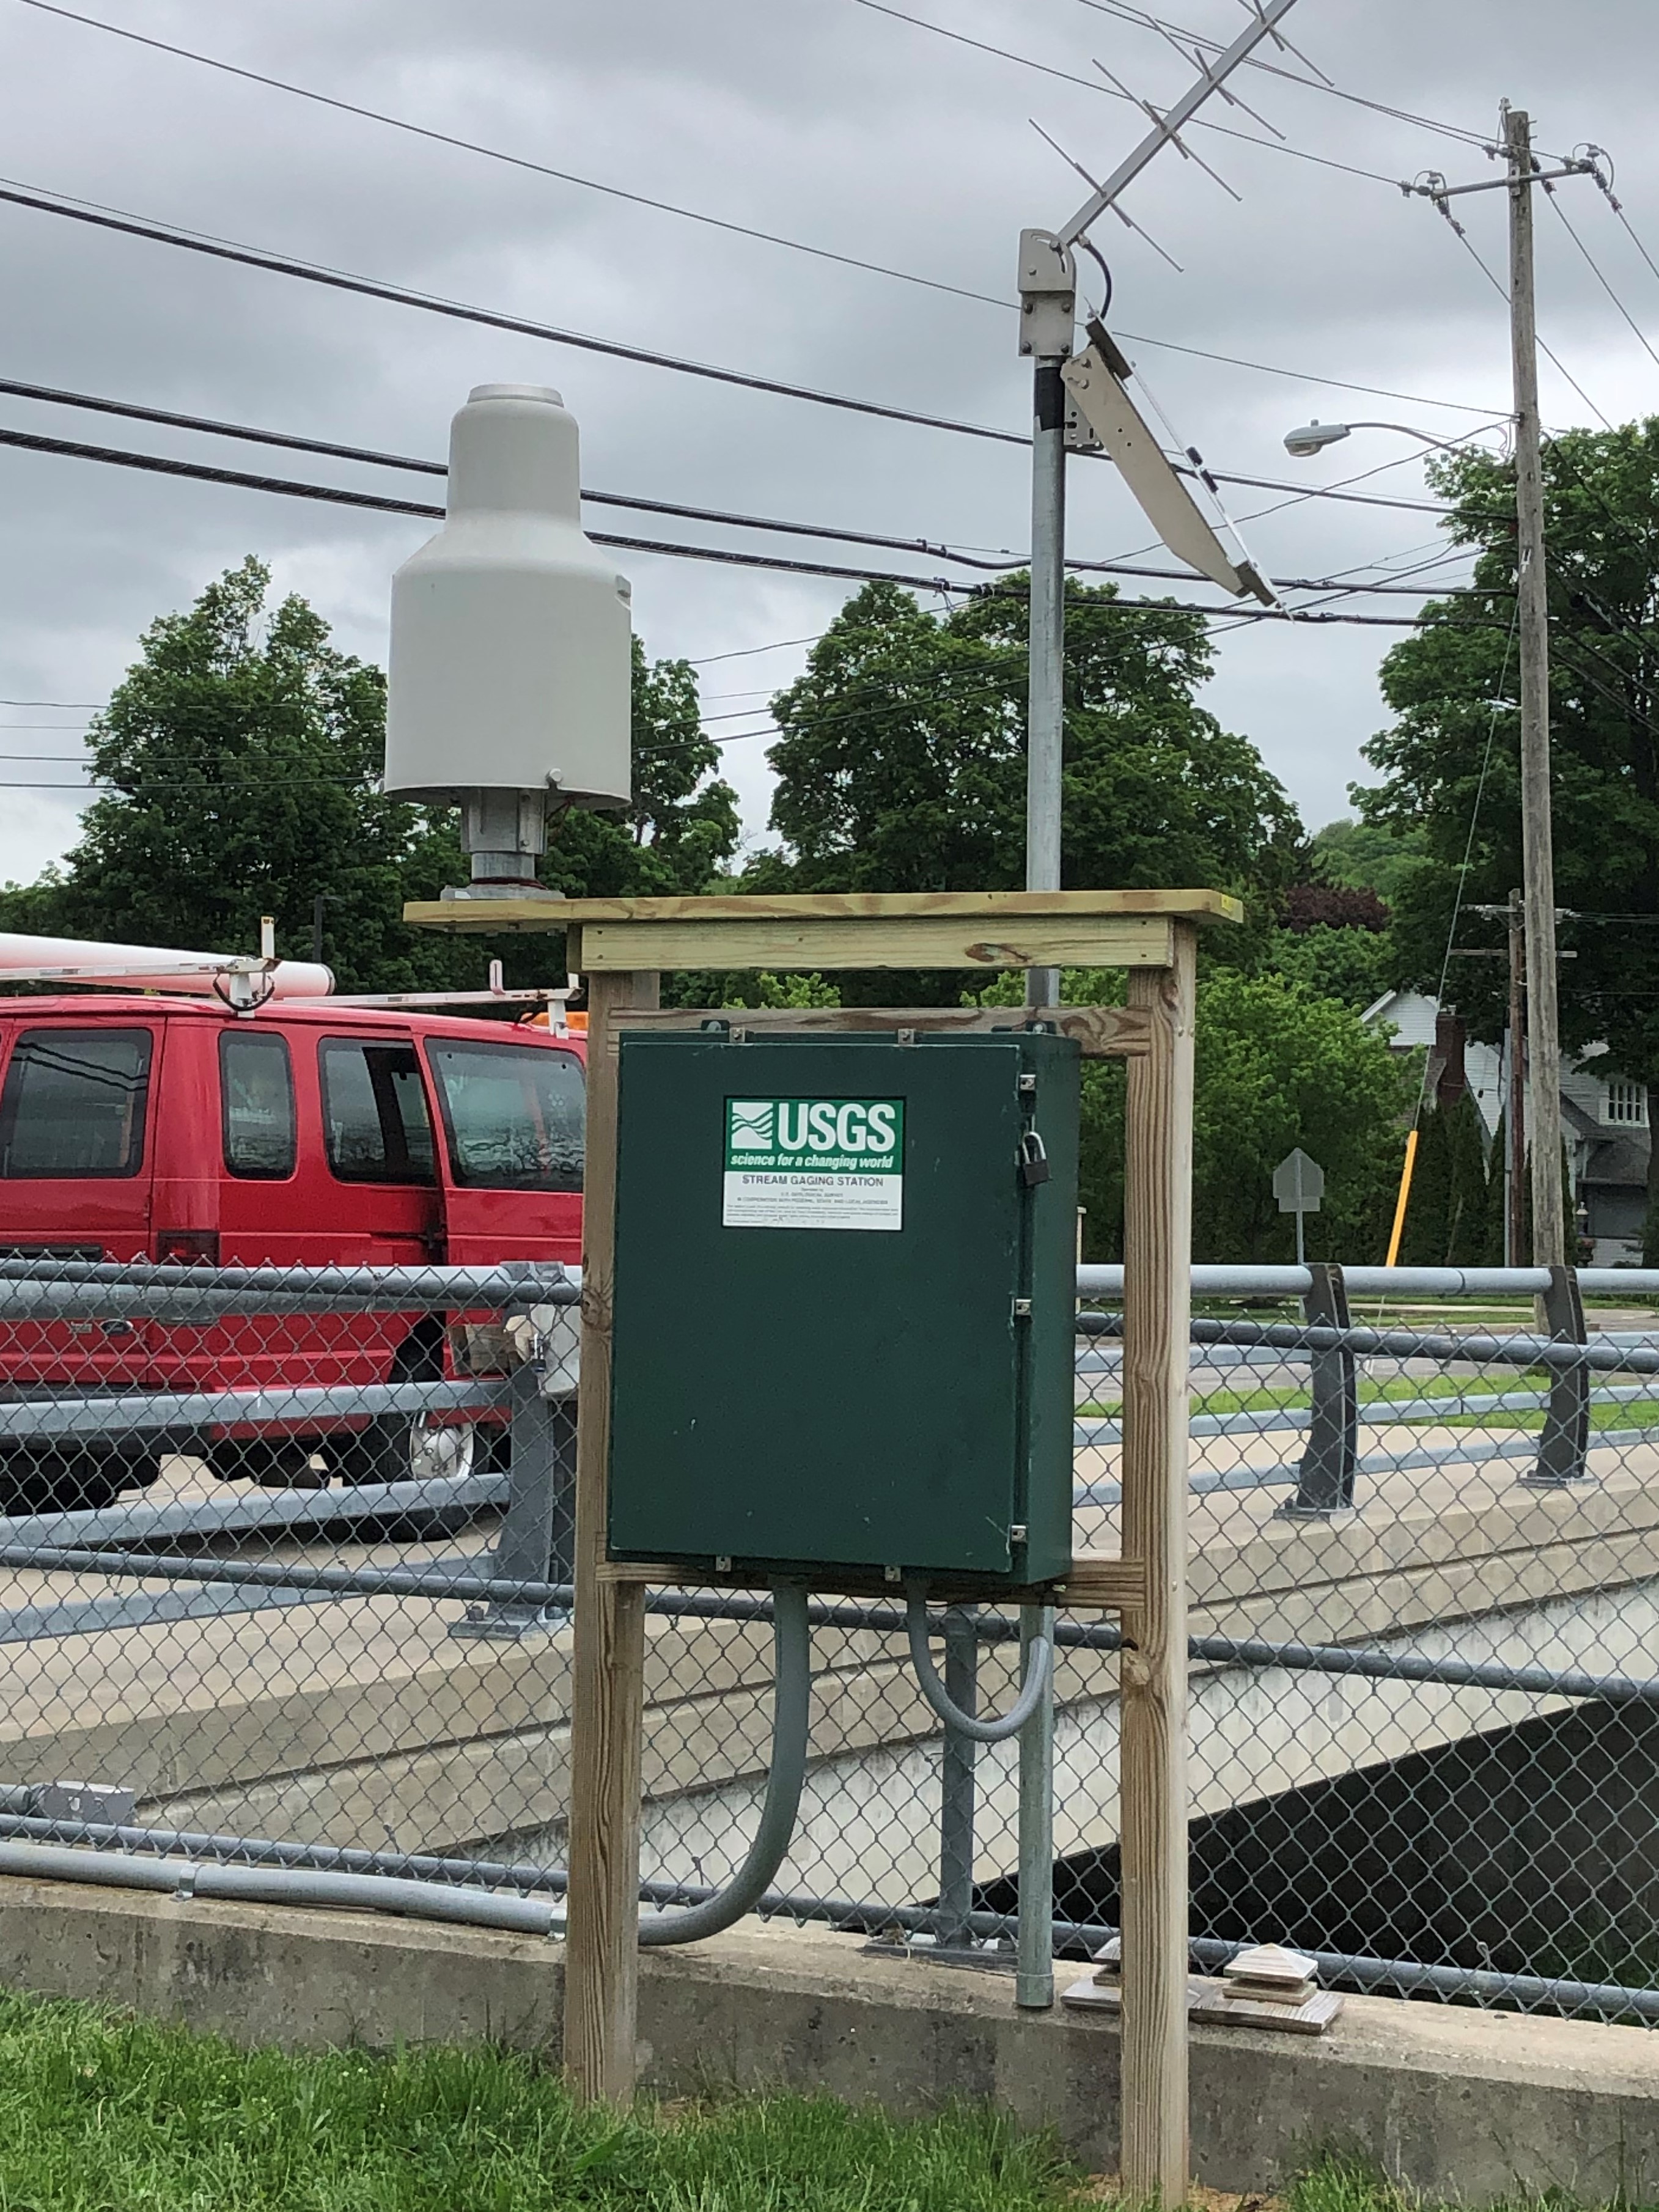 Station image
Summary of all available data for this site
Instantaneous-data availability statement


