PROVISIONAL DATA SUBJECT TO REVISION
Click to hidestation-specific text
The 15-minute precipitation data for this
station are temporary and will only be displayed for 120 days.
Although the instrumentation is calibrated at least once/year, the
temporary classification means that documented routine inspections and
other quality assurance measures are not performed that would make the
data acceptable for archival, retrieval, or future use in general
scientific or interpretive studies.
 Site Information
Funding for this site is provided by:
Site Information
LOCATION.--Lat 43°00'36", long
77°47'29" referenced to North American Datum of 1983,
Monroe County, NY, Hydrologic Unit 04130003, on right bank 40
ft downstream from bridge on Union Street in Garbutt, 1.5 mi
west of Scottsville, and 4.2 mi upstream from mouth.
DRAINAGE AREA.--205 mi².
PERIOD OF RECORD.--October 1945 to current year.
REVISIONS HISTORY.--WDR NY-82-3: Drainage area. WDR NY-71-1: 1960 (M). WDR NY-93-3: 1991. WDR NY-97-3: 1996 (P).
GAGE.--Water-stage recorder. Datum of gage is 560.86 ft above NGVD of 1929 and 560.15 ft above NAVD of 1988.
REMARKS.--Water Years 2014-23: Records good except those for estimated daily discharges, which are poor.
EXTREMES FOR PERIOD OF RECORD.--Maximum discharge, 7,050 ft³/s, Mar. 31, 1960, gage height, 8.64 ft; minimum discharge, 3.3 ft³/s, Sept. 11, 12, 1958; minimum gage height, 1.88 ft, June 19, 1959, result of regulation.
PERIOD OF DAILY RECORD1.-- WATER TEMPERATURES: October 1959 to March 1961. SUSPENDED SEDIMENT DISCHARGE: March 1975 to September 1977.
INSTRUMENTATION1.--Automatic water sampler since July 1997.
COOPERATION1.--Water-quality samples were collected by the Monroe County Department of Environmental Services and analyzed by the Monroe County Environmental Laboratory at Rochester, NY. Prior to 2003, water-quality samples were collected by the Monroe County Environmental Laboratory at Rochester, N.Y.
EXTREMES FOR PERIOD OF DAILY RECORD1.-- SUSPENDED-SEDIMENT CONCENTRATION: Maximum daily mean, 282 mg/L Aug. 17, 1997, minimum daily mean, 0 mg/L, Apr. 14, 1975. SUSPENDED-SEDIMENT DISCHARGE: Maximum daily, 2,980 tons, Mar. 5, 1976, minimum daily, 0 ton, Apr. 14, 1975.
1 Water-Quality Records
 WaterAlert – get an
email or text (SMS) alert based on your chosen threshold.
WaterAlert – get an
email or text (SMS) alert based on your chosen threshold.
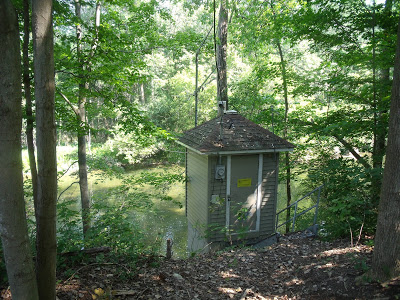 Station image
Summary of all available data for this site
Instantaneous-data availability statement


