PROVISIONAL DATA SUBJECT TO REVISION
Click to hidestation-specific text
Funding for this site is provided by:
 Site Information
LOCATION.--Lat 43°44'48.5", long
75°20'00.4" referenced to North American Datum of
1983, Lewis County, NY, Hydrologic Unit 04150101, on right bank
at downstream side of bridge on Donnattsburg Road at
Donnattsburg, 1.2 mi downstream from Chase Lake Outlet, 4.2 mi
northeast of Glenfield, and 5.0 mi upstream from mouth.
DRAINAGE AREA.--88.7 mi².
PERIOD OF RECORD.--July 1942 to current year.
REVISIONS HISTORY.--WDR NY-87-1: Drainage area.
GAGE.--Water-stage recorder and crest-stage gage. Datum of gage is 972.84 ft above NGVD of 1929 and 972.40 ft above NAVD of 1988. Prior to Sept. 16, 1949, nonrecording gage at same site and datum.
REMARKS.--Water Years 2014-22: Records good except those for estimated daily discharges, which are poor.
EXTREMES FOR PERIOD OF RECORD.--Maximum discharge, 9,420 ft³/s, Dec. 30, 1984, gage height, 13.34 ft, from rating curve extended above 3,200 ft³/s on basis of slope-area measurement of peak flow; minimum discharge, 15 ft³/s, July 23, 2018; minimum gage height, 2.85 ft, Sept. 17, 1948, Aug. 4, 5, 1949.
 WaterAlert – get an
email or text (SMS) alert based on your chosen threshold.
WaterAlert – get an
email or text (SMS) alert based on your chosen threshold.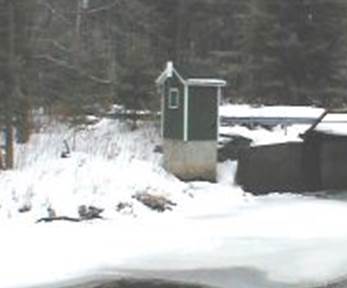 Station image
Summary of all available data for this site
Instantaneous-data availability statement

