PROVISIONAL DATA SUBJECT TO REVISION
 Site Information
DRAINAGE AREA.--784 mi².
PERIOD OF RECORD.--October 1912 to current year. October 2001 through September 2004 published as East Branch Delaware River above Read Creek at Fishs Eddy (station 01420980). Monthly discharge only for some periods, published in WSP 1302.
REVISIONS HISTORY.--WDR NY-82-1: Drainage area.
GAGE.--Water-stage recorder and crest-stage gage. Datum of gage is 955.96 ft above NGVD of 1929 and 955.47 ft above NAVD of 1988. Prior to Sept. 27, 1928, nonrecording gage, and Sept. 28, 1928 to Nov. 1, 1967, water-stage recorder, at site 3,000 ft downstream at datum 5.0 ft lower. Nov. 2, 1967 to Sept. 30, 2001, at site on left bank at same datum, and Oct. 1, 2001 to Sept. 30, 2004, at site 0.30 mi upstream at same datum.
REMARKS.--
Subsequent to September 1954, entire flow from 371 mi² of
drainage area controlled by Pepacton Reservoir (station
01416900). Part of flow diverted for New York City municipal
supply. Remainder of flow (except for conservation releases and
spill) impounded for release during periods of low flow in the
lower Delaware River basin, as directed by the Delaware River
Master.
Water Year 2014: Records fair except those for estimated daily
discharges, which are poor.
Water Year 2015: Records poor.
Water Year 2016: Records fair except those prior to June 22,
which are poor.
Water Years 2017-23: Records good except those for
estimated daily discharges, which are poor.
EXTREMES FOR PERIOD OF RECORD.--Maximum discharge, since construction of Pepacton Reservoir in 1954, 77,400 ft³/s, June 28, 2006, gage height, 21.43 ft, from rating curve extended above 35,000 ft³/s; minimum discharge, 52 ft³/s, July 23, 1964, gage height, 1.16 ft, site and datum then in use.
EXTREMES OUTSIDE PERIOD OF RECORD.--Flood of Oct. 9, 1903, reached a stage of 23.6 ft, at site 3,000 ft downstream at datum 5.0 ft lower, from description obtained in April 1939, from local residents who had experienced the flood (discharge, about 70,000 ft³/s, from rating curve extended above 22,000 ft³/s).
EXTREMES FOR PERIOD PRIOR TO REGULATION.--Maximum discharge, prior to construction of Pepacton Reservoir in 1954, 53,300 ft³/s, Aug. 24, 1933, gage height, 20.60 ft, site and datum then in use, from rating curve extended above 22,000 ft³/s; minimum daily discharge, 68 ft³/s, Aug. 28, 1949; minimum instantaneous discharge not determined.
PERIOD OF DAILY RECORD1.--WATER TEMPERATURE: November 1967 to current year. From October 2001 to September 2004, published as East Branch Delaware River above Read Creek at Fishs Eddy (station 01420980).
INSTRUMENTATION1.--Water-temperature satellite and telephone telemeter provides 15-minute-interval readings. From October 1975 to June 1993, water-temperature recorder provided one-hour-interval readings. Prior to October 1975, water-temperature recorder provided continuous recordings.
REMARKS1.--Temperature readings prior to Oct. 1, 2007, rounded to the nearest 0.5 °C. Water temperature is affected by release of water from upstream reservoir.
EXTREMES FOR PERIOD OF DAILY RECORD1.--WATER TEMPERATURE: Prior to Oct. 1, 2007--Maximum (water years 1968-75, 1978, 1980-82, 1984, 1986-95, 1999-2003, 2005-07), 31.5 °C, Aug. 2, 1975; minimum (water years 1968-76, 1978-79, 1981-2007), 0.0 °C on many days during winter periods, except 1978. WATER TEMPERATURE: After Oct. 1, 2007--Maximum, 28.1 °C, July 2, 2018; minimum, -0.1 °C, Jan. 2, 3, 2013.
1 Water-Quality Records
 WaterAlert – get an
email or text (SMS) alert based on your chosen threshold.
WaterAlert – get an
email or text (SMS) alert based on your chosen threshold.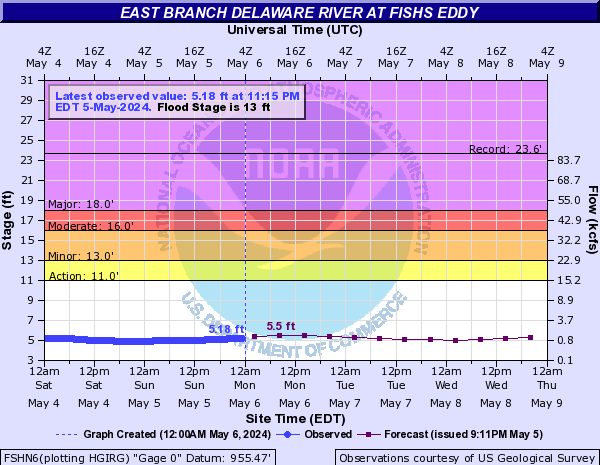
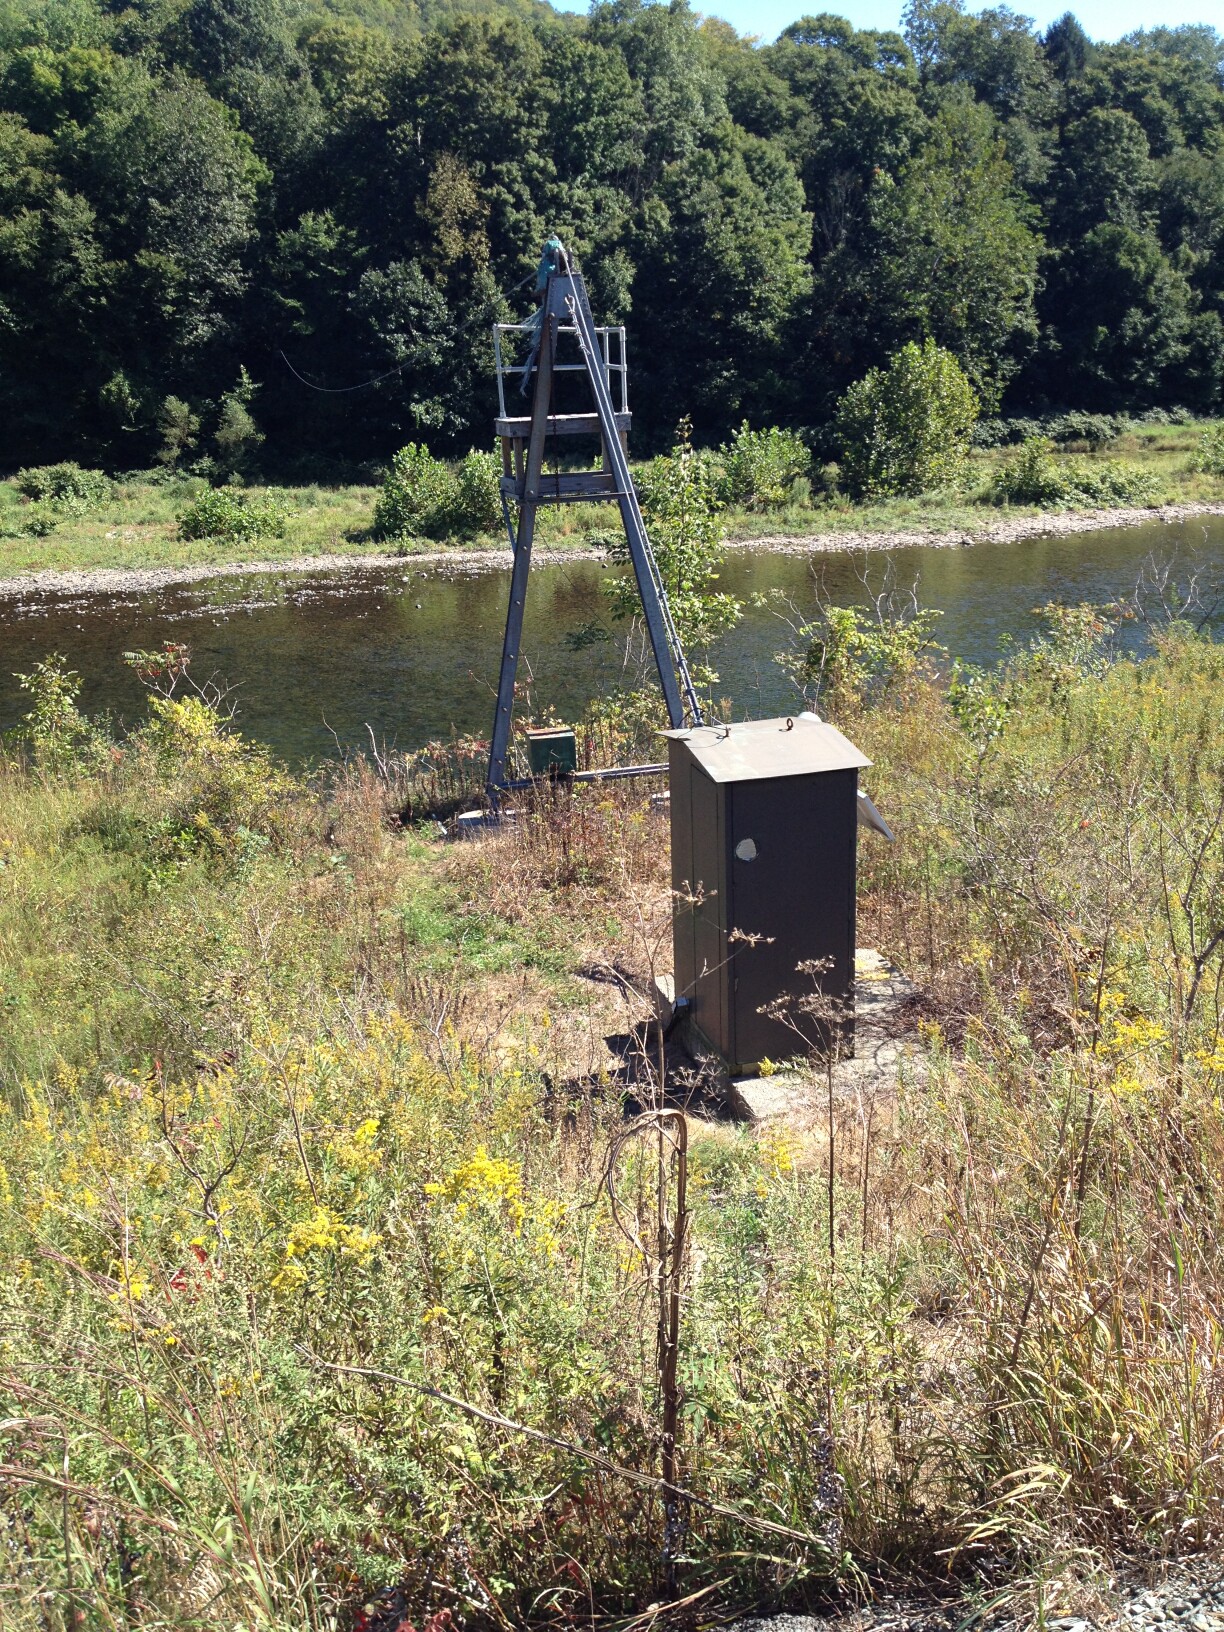 Station image
Summary of all available data for this site
Instantaneous-data availability statement


