PROVISIONAL DATA SUBJECT TO REVISION
Click to hidestation-specific text
Funding for this site is provided by:
 Site Information
LOCATION.--Lat 42°01'28.5", long
75°07'09.4" referenced to North American Datum of
1983, Delaware County, NY, Hydrologic Unit 02040102, on right
bank 800 ft downstream from Baxter Brook, and 1,100 ft
downstream from Harvard Road bridge at Harvard.
DRAINAGE AREA.--458 mi².
PERIOD OF RECORD.--October 1934 to June 1967, November 1977 to current year.
REVISIONS HISTORY.--WDR NY-82-1: Drainage area. WDR NY-84-1: 1978-81(M).
GAGE.--Water-stage recorder and crest-stage gage. Datum of gage is 1,007.41 ft above NGVD of 1929 and 1,006.86 ft above NAVD of 1988. Prior to Aug. 12, 1958, at site 1,100 ft upstream at datum 0.65 ft higher, and from Aug. 12, 1958 to June 30, 1967, at site 200 ft downstream at same datum.
REMARKS.--Subsequent to September 1954, entire flow from 371 mi² of drainage area controlled by Pepacton Reservoir (station 01416900). Part of flow diverted for New York City municipal supply. Remainder of flow (except for conservation releases and spill) impounded for release during periods of low flow in the lower Delaware River Basin, as directed by the Delaware River Master.
Water Years 2014-16: Records good except those for estimated daily discharges, which are poor. Water Years 2017-23: Records fair except those for estimated daily discharges, which are poor.
EXTREMES FOR PERIOD OF RECORD.--Maximum discharge, since construction of Pepacton Reservoir in 1954, 22,100 ft³/s, June 28, 2006, gage height, 16.61 ft; minimum discharge, 7.2 ft³/s, Oct. 13, 1954, gage height, 1.63 ft, site and datum then in use.
EXTREMES FOR PERIOD PRIOR TO REGULATION.--Maximum discharge, prior to construction of Pepacton Reservoir in 1954, 31,400 ft³/s, Sept. 22, 1938, gage height, 16.93 ft, site and datum then in use, from rating curve extended above 15,000 ft³/s on basis of slope-area measurement at gage height 15.58 ft, datum then in use.
PERIOD OF DAILY RECORD1.--WATER TEMPERATURE: June 1978 to current year.
INSTRUMENTATION1.--Water-temperature satellite and telephone telemeter provides 15-minute-interval readings. Prior to June 1994, water-temperature recorder provided one-hour interval readings.
REMARKS1.--Temperature readings prior to Oct. 1, 2007, rounded to nearest 0.5 °C. Water temperature is affected by release of water from upstream reservoir.
EXTREMES FOR PERIOD OF DAILY RECORD1.--WATER TEMPERATURE: Prior to Oct. 1, 2007--Maximum (water years 1978, 1981-82, 1984-2007), 28.0 °C, June 30, 1981; minimum (water years 1979-87, 1989-2007), 0.0 °C on many days during winter periods, except 1989, 1998. WATER TEMPERATURE: After Oct. 1, 2007--Maximum, 22.8 °C, June 10, 2008, July 18, 2010, June 21, 2012, July 27, 2020; minimum, -0.2 °C, Feb. 11, 29, 2008.
1 Water-Quality Records
 WaterAlert – get an
email or text (SMS) alert based on your chosen threshold.
WaterAlert – get an
email or text (SMS) alert based on your chosen threshold.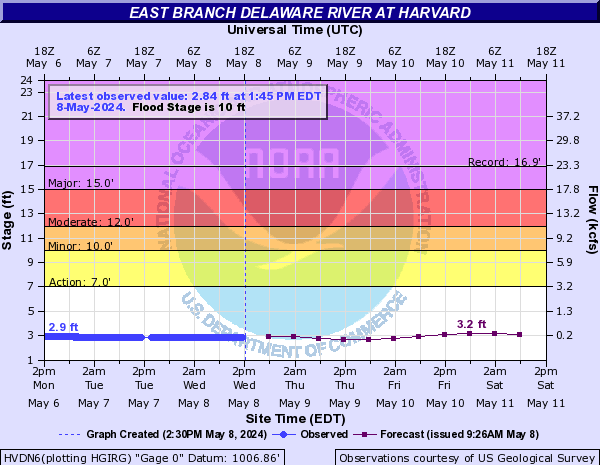
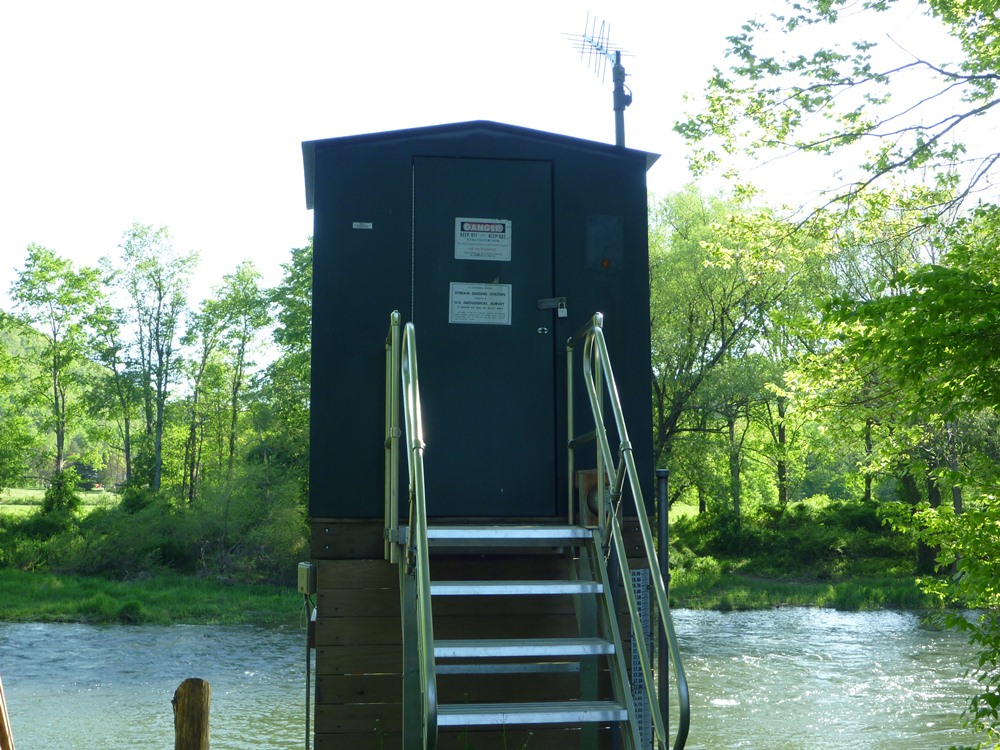 Station image
Summary of all available data for this site
Instantaneous-data availability statement


