PROVISIONAL DATA SUBJECT TO REVISION
Click to hidestation-specific text
Funding for this site is provided by:
 Site Information
LOCATION.--Lat 42°08'01.0", long
74°13'53.5" referenced to North American Datum of
1983, Greene County, NY, Hydrologic Unit 02020006, on right
bank at downstream side of culvert on State Highway 214 at
Edgewood.
DRAINAGE AREA.--1.81 mi².
PERIOD OF RECORD.--November 2016 to current year.
GAGE.--Water-stage recorder and crest-stage gage. Datum of gage is 1,530 ft above NAVD of 1988, from topographic map.
REMARKS.--Water Years 2017-22, 2024: Records fair except those for estimated daily discharges, which are poor. Water Year 2023: Records poor.
EXTREMES FOR PERIOD OF RECORD.--Maximum discharge, about 400 ft³/s, Dec. 25, 2020, by computation of peak flow on basis of runoff comparisons with nearby stations, gage height, 8.00 ft, from floodmarks; minimum discharge, 0.19 ft³/s, Aug. 29, 30, 2022, gage height, 3.57 ft.
 WaterAlert – get an
email or text (SMS) alert based on your chosen threshold.
WaterAlert – get an
email or text (SMS) alert based on your chosen threshold.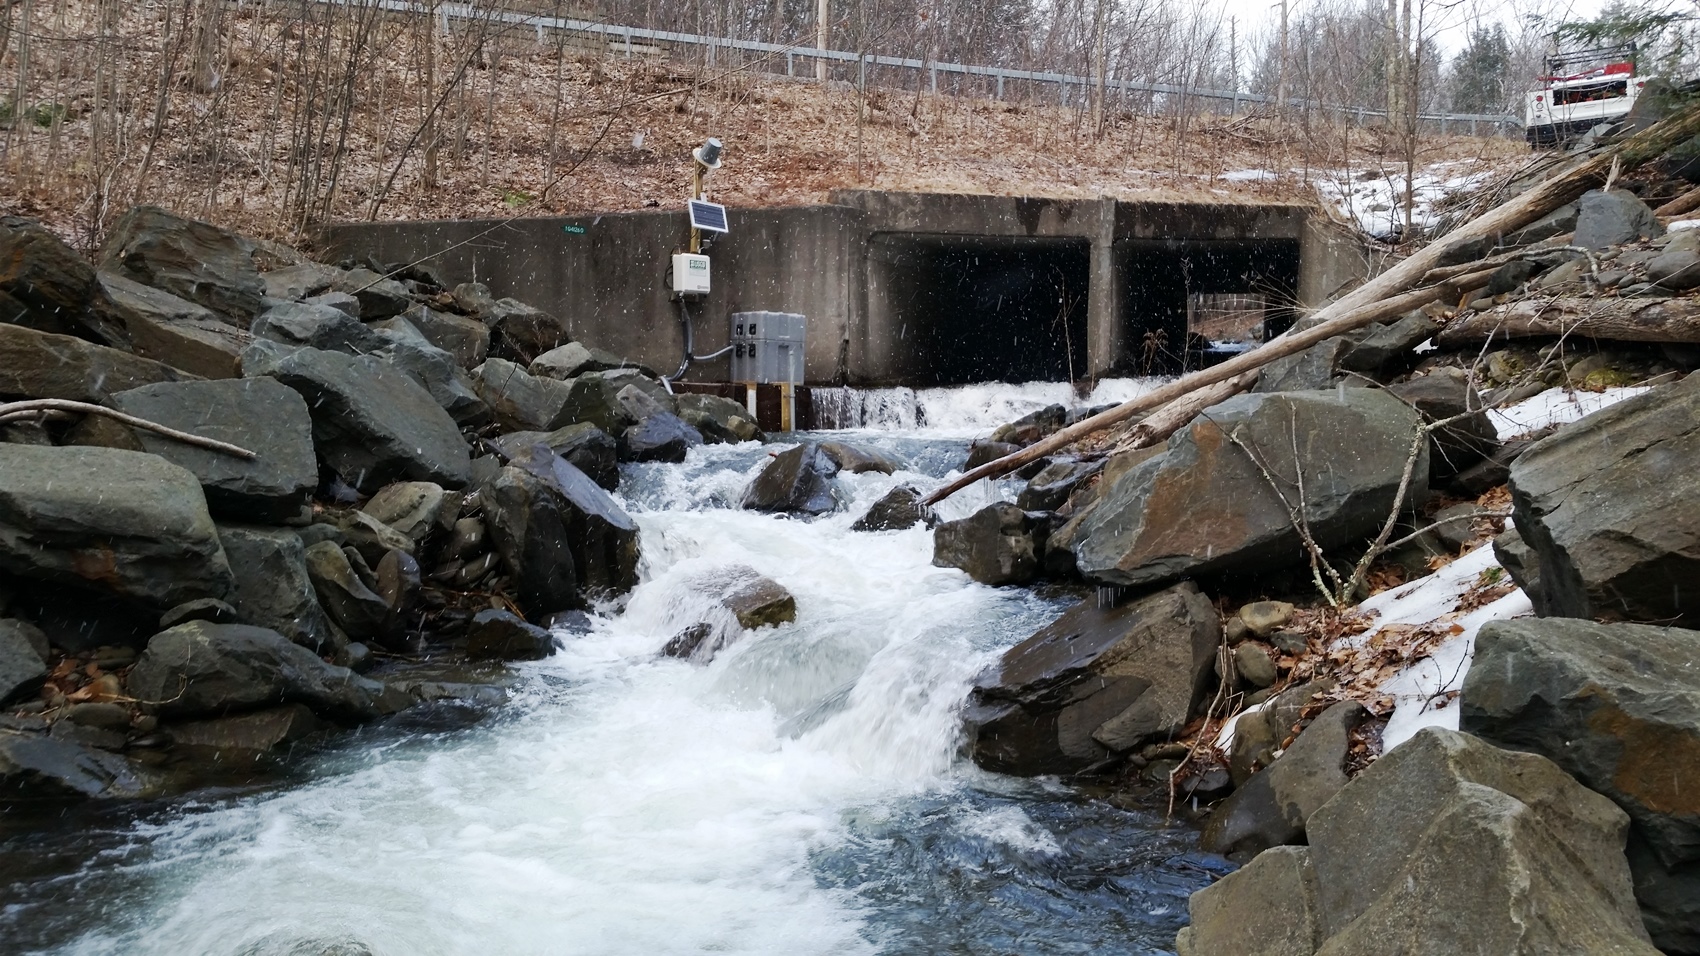 Station image
Summary of all available data for this site
Instantaneous-data availability statement


![Graph of Turbidity, water, unfiltered, monochrome near infra-red LED light, 780-900 nm, detection angle 90 +-2.5 degrees, formazin nephelometric units (FNU), [Observator, Analite NEP 5000 S]](https://natwebsdww01.cr.usgs.gov/nwisweb/data/img/USGS.01362322.335316.63680..20260218.20260321..0..gif)

