PROVISIONAL DATA SUBJECT TO REVISION
Click to hidestation-specific text
 Site Information
LOCATION.--Lat 42°34'52.6", long
74°19'02.8" referenced to North American Datum of
1983, Schoharie County, NY, Hydrologic Unit 02020005,
on downstream right
bank at bridge on State Highway 145, 1.5 mi southeast of
Middleburgh, and 1.6 mi upstream from mouth.
DRAINAGE AREA.--18.1 mi².
PERIOD OF RECORD.--December 2017 to current year.
REVISIONS HISTORY.--Gage height for the period Feb. 14, 28, 2022, was revised on Feb. 16, 2024, based on correction to the downloaded data.
GAGE.--Water-stage recorder and crest-stage gage. Datum of gage is 784.76 ft above NAVD of 1988. Prior to Apr. 19, 2019, on right bank at site .6 mi upstream at same datum.
REMARKS.--Water Year 2018: Records poor.
Water Year 2019: Records good except those for estimated daily discharges and those prior to Apr. 15, which are poor.
Water Years 2020-22: Records fair except those for estimated daily discharges, which are poor.
EXTREMES FOR PERIOD OF RECORD.--Maximum discharge, 2,400 ft³/s, July 11, 2021, gage height 7.25 ft, from floodmarks; minimum discharge, 0.27 ft³/s, Aug. 30, 2022, gage height, 1.59 ft; minimum gage height, 1.58 ft, Aug. 17, 29, 30, 2022.
 WaterAlert – get an
email or text (SMS) alert based on your chosen threshold.
WaterAlert – get an
email or text (SMS) alert based on your chosen threshold.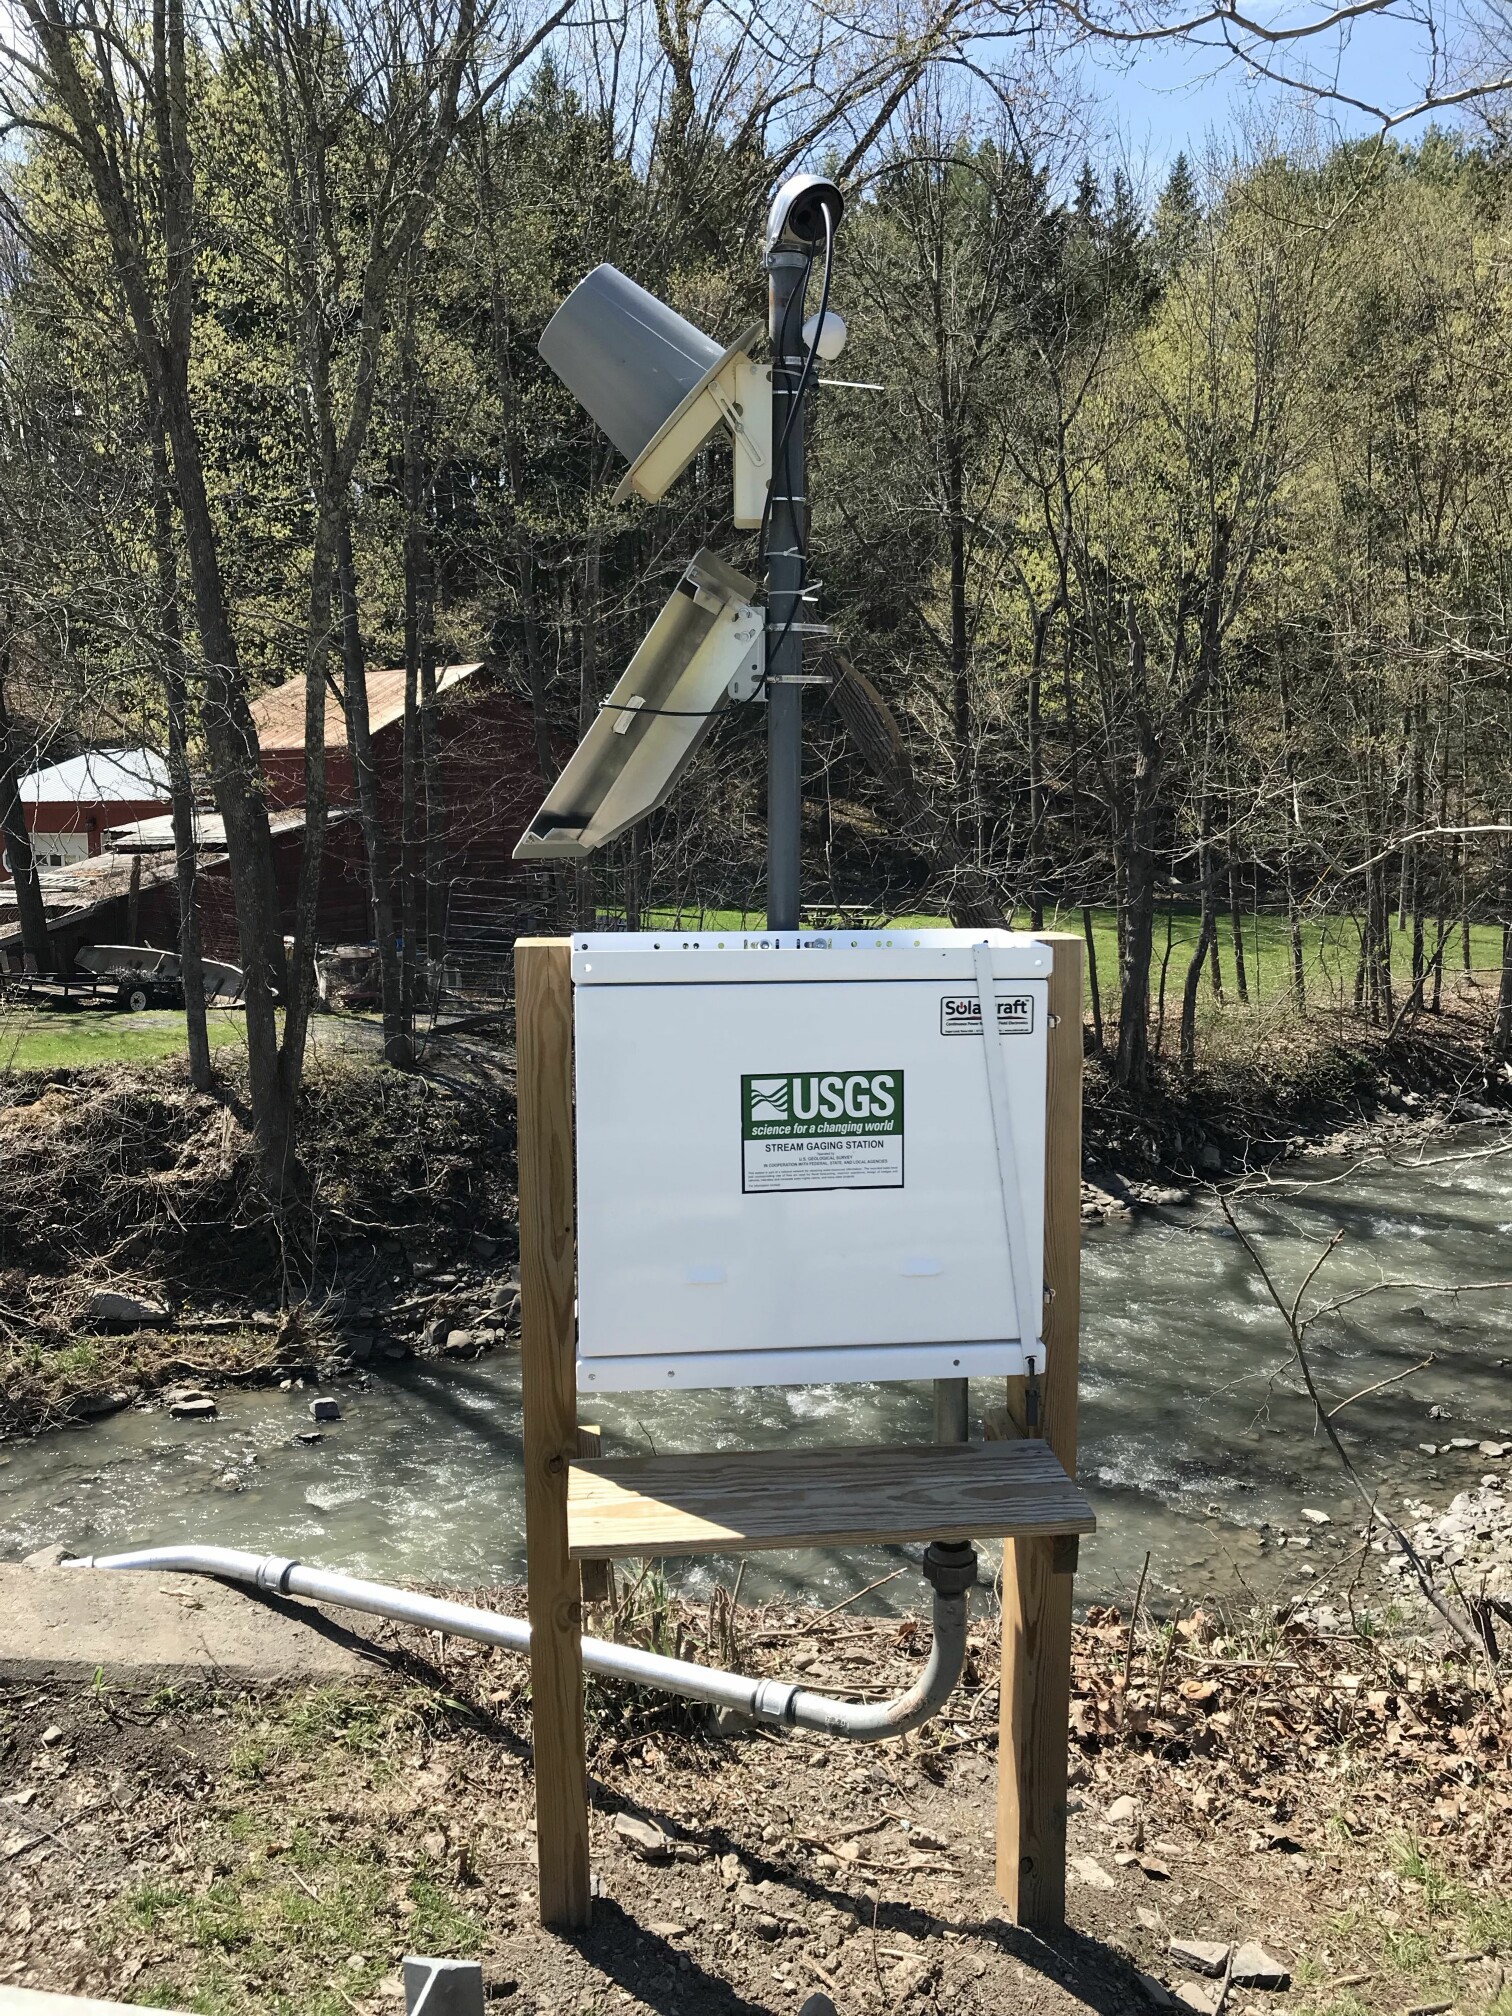 Station image
Summary of all available data for this site
Instantaneous-data availability statement

