PROVISIONAL DATA SUBJECT TO REVISION
Click to hidestation-specific text
Funding for this site is provided by:
 Site Information
LOCATION.--Lat 42°27'12", long
76°28'22" referenced to North American Datum of 1983,
Tompkins County, NY, Hydrologic Unit 04140201, on left bank
0.18 mi downstream from bridge on Forest Home Drive, 0.2 mi
upstream of Beebe Lake dam, 2.0 mi northeast of Ithaca, and 2.2
mi upstream from mouth.
DRAINAGE AREA.--126 mi².
PERIOD OF RECORD.--July 1908 to June 1909 (gage heights only), February 1925 to current year.
REVISIONS HISTORY.--WSP 874: 1935-38. WSP 1912: Drainage area.
GAGE.--Water-stage recorder, crest-stage gage, and concrete control. Datum of gage is 795.13 ft above NGVD of 1929 and 794.52 ft above NAVD of 1988. July 1908 to June 1909, nonrecording gage at bridge 1.2 mi downstream at different datum.
REMARKS.--Diversion from point about 1 mi upstream from station by Cornell University for water supply and at several sites for irrigation purposes. Records of diversion from Fall Creek are in files of Cornell University.
Water Years 2014-23: Records good except those for estimated daily discharges, which are fair.
EXTREMES FOR PERIOD OF RECORD.--Maximum discharge, about 15,500 ft³/s, July 8, 1935, gage height, 9.52 ft, from rating curved extended above 5,500 ft³/s on basis of computation of average of peak flow over four dams; maximum gage height, 11.16 ft, Feb. 21, 1971 (ice jam); minimum discharge, 2.1 ft³/s, Sept. 6, 7, 1999, gage height, 0.12 ft.
 WaterAlert – get an
email or text (SMS) alert based on your chosen threshold.
WaterAlert – get an
email or text (SMS) alert based on your chosen threshold.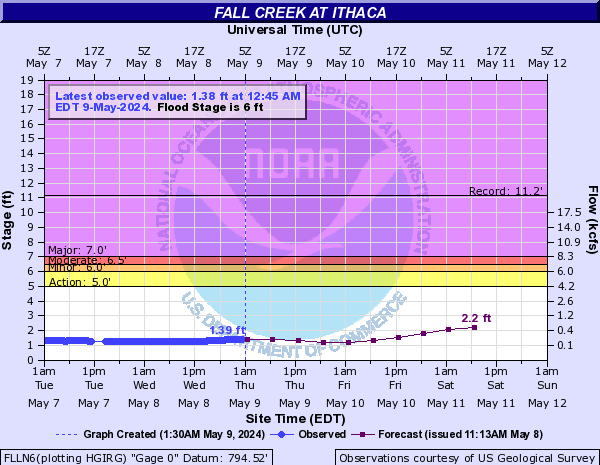
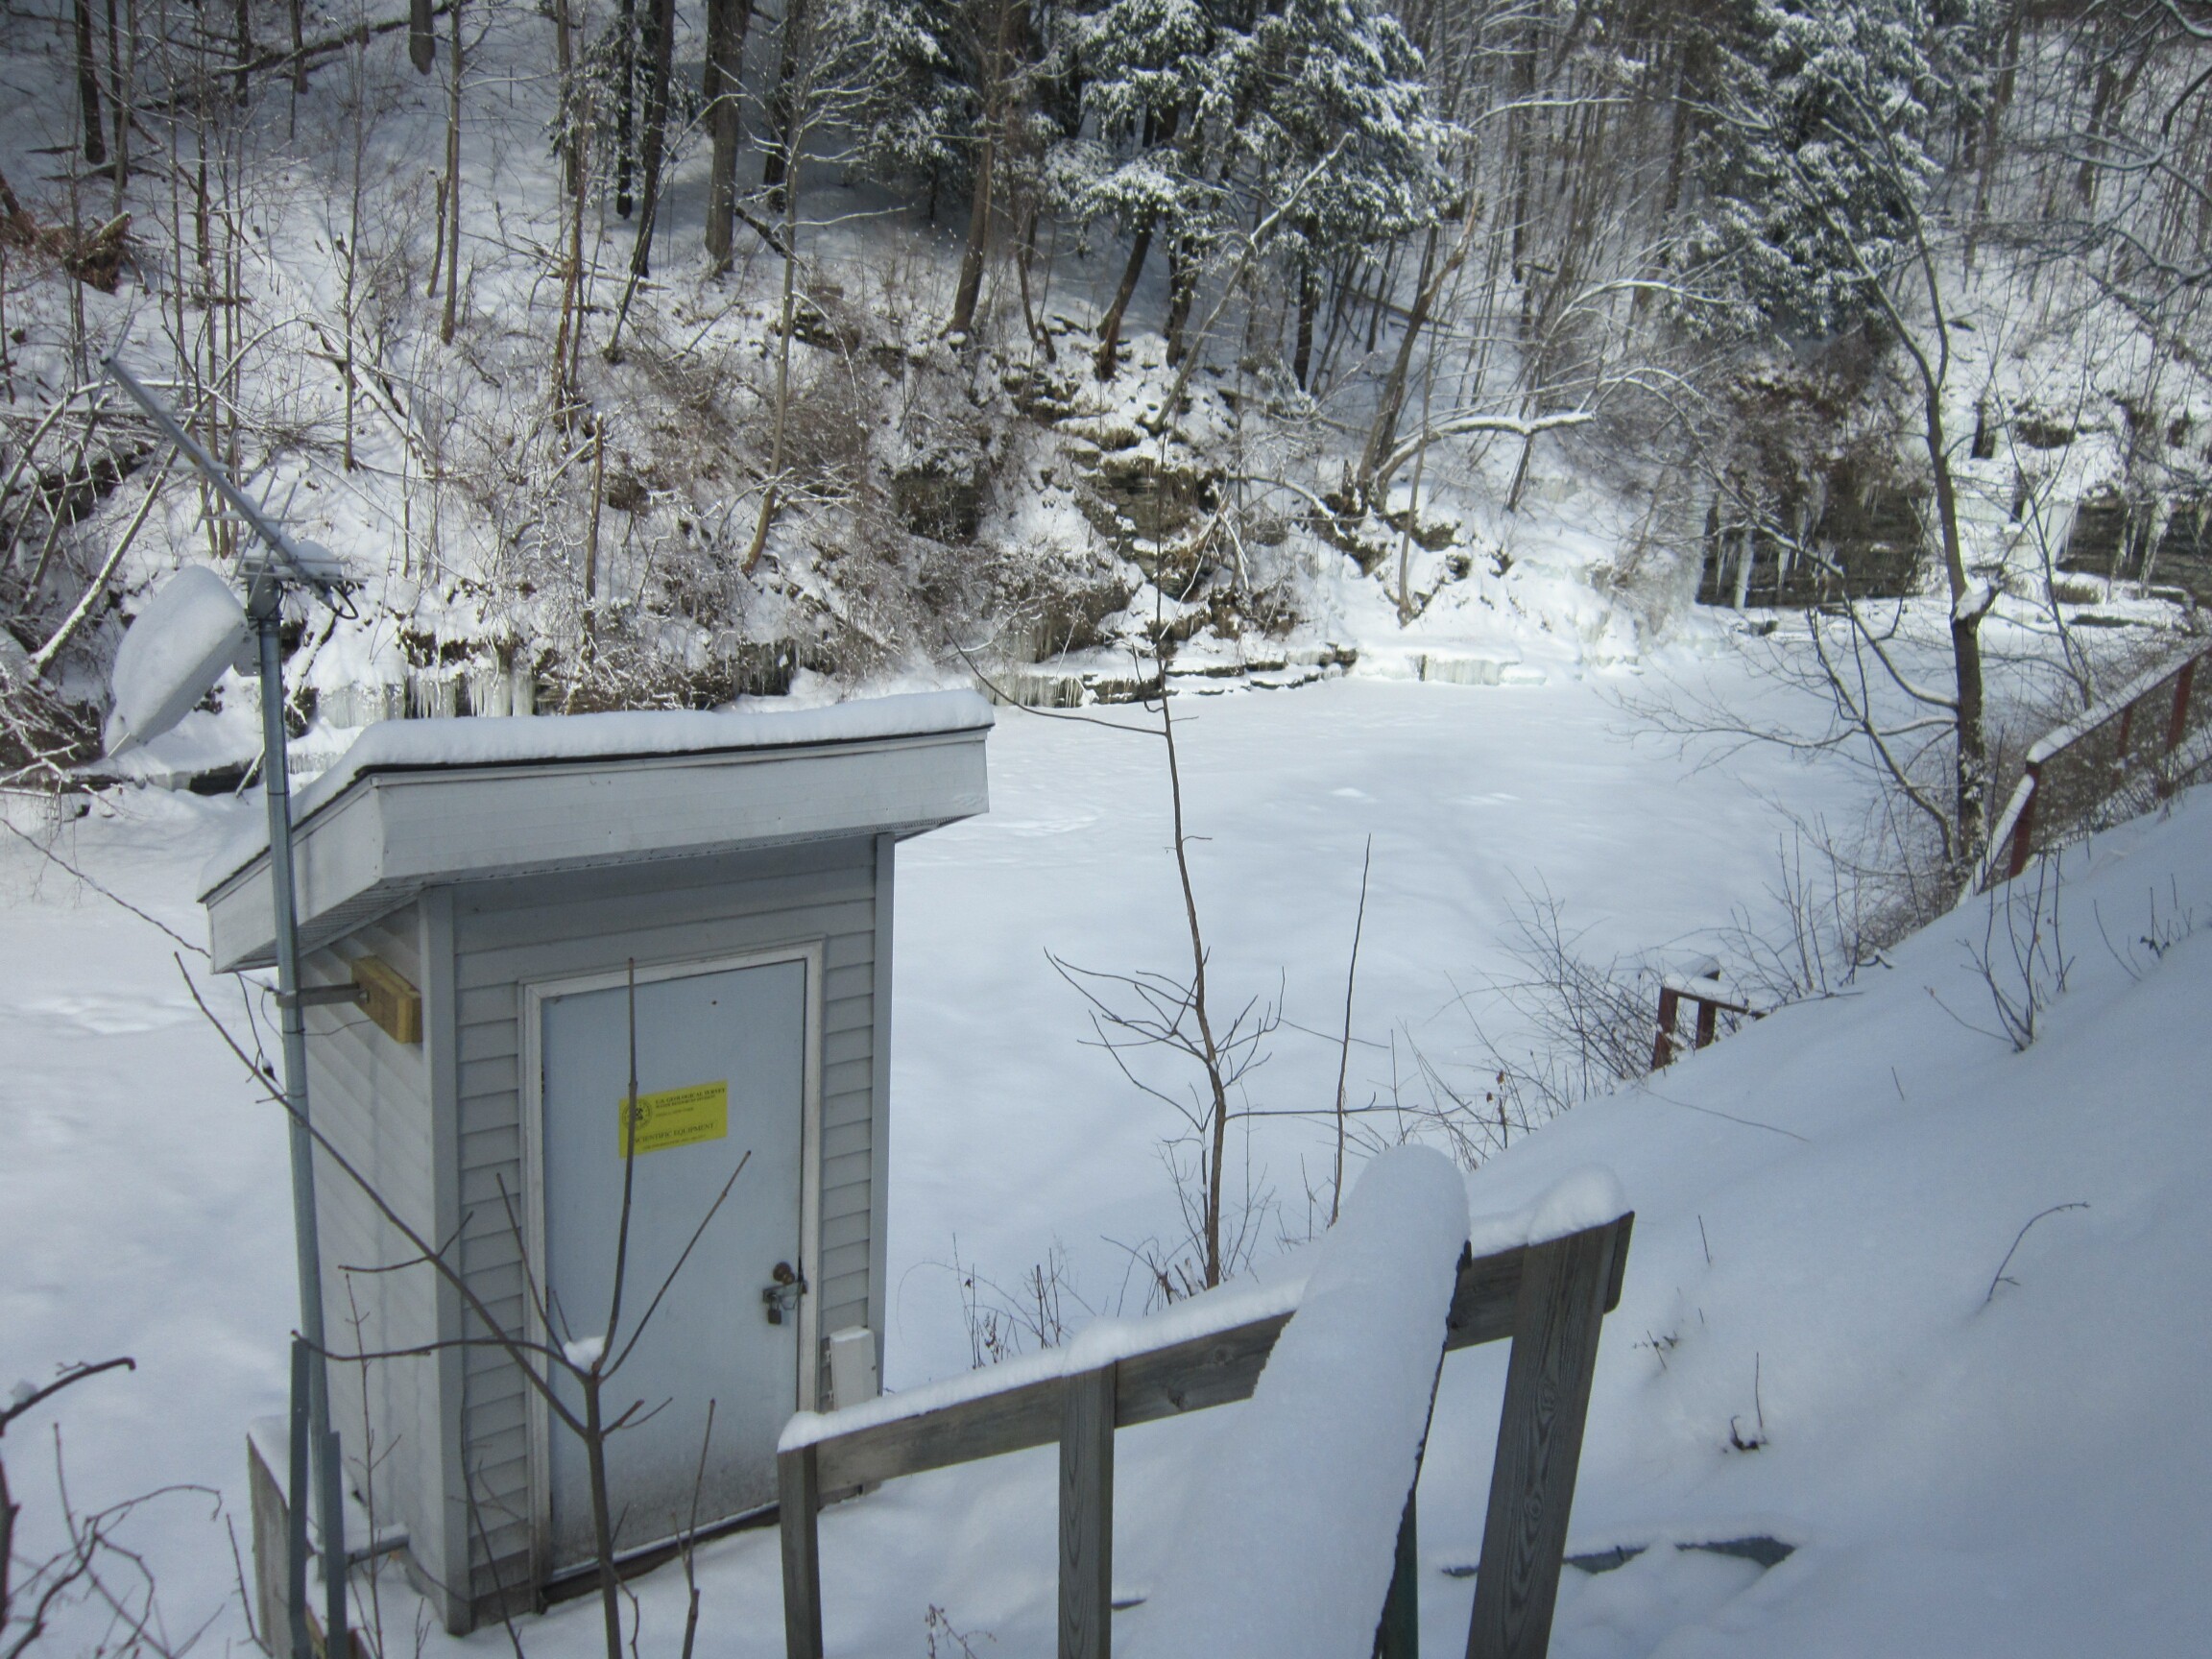 Station image
Summary of all available data for this site
Instantaneous-data availability statement

