USGS 03272000 Twin Creek near Germantown OH

PROVISIONAL DATA SUBJECT TO REVISION

Click to hidestation-specific text
Funding for this site is provided by:


> WaterNow – get the latest gage data from your mobile phone or email.
> Rating Information
This station managed by the Columbus Field Office.

Available Parameters Available Period
  
2025-11-05  2026-03-05
1990-10-01  2026-03-05
2007-10-01  2026-03-05
2025-11-05  2026-03-05


 (7)
 

  -- or --


Summary of all available data for this site
Instantaneous-data availability statement
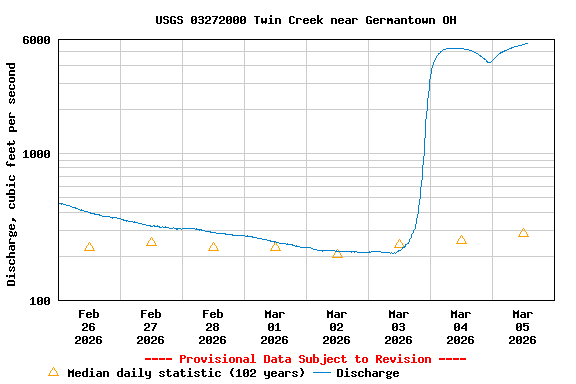

Precipitation, total, inches

Most recent instantaneous value: 0.00 03-05-2026   12:30 EST
Graph of  Precipitation, total, inches

Add up to 2 more sites and replot for "Precipitation, total, inches"

?


Create presentation-quality / stand-alone graph.   Subscribe to WaterAlert      

See this graph on the Monitoring Location Pages


Discharge, cubic feet per second

Most recent instantaneous value: 5580 03-05-2026   12:30 EST
Graph of  Discharge, cubic feet per second

Add up to 2 more sites and replot for "Discharge, cubic feet per second"

?


Create presentation-quality / stand-alone graph.   Subscribe to WaterAlert      

See this graph on the Monitoring Location Pages


Daily discharge, cubic feet per second -- statistics for Mar 5 based on 102 water years of record more
Min
(1935)
25th
percen-
tile
Median 75th
percen-
tile
Mean Most Recent
Instantaneous
Value Mar 5
Max
(1963)
16.0 147 284 693 704 5580 8200


Gage height, feet

Most recent instantaneous value: 29.59 03-05-2026   12:30 EST
Graph of  Gage height, feet

Add up to 2 more sites and replot for "Gage height, feet"

?


Create presentation-quality / stand-alone graph.   Subscribe to WaterAlert      

See this graph on the Monitoring Location Pages


DCP battery voltage, volts

Most recent instantaneous value: 13.6 03-05-2026   12:00 EST
Graph of  DCP battery voltage, volts

Add up to 2 more sites and replot for "DCP battery voltage, volts"

?


Create presentation-quality / stand-alone graph.   Subscribe to WaterAlert      

See this graph on the Monitoring Location Pages