USGS 01449360 Pohopoco Creek at Kresgeville, PA

PROVISIONAL DATA SUBJECT TO REVISION

Click to hidestation-specific text


Station gage image
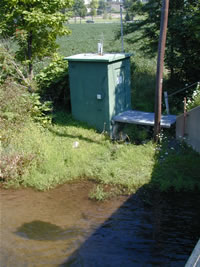
STATION.--01449360 POHOPOCO CREEK AT KRESGEVILLE, PA
LOCATION.--Lat 40`53'51", long 75`30'10", Monroe County, Hydrologic Unit 02040106, on right bank 20 ft downstream from bridge on U.S. Highway 209 at Kresgeville, 0.2 mi downstream from Middle Creek, and 13 mi northeast of Lehighton.
DRAINAGE AREA.--49.9 square miles.
PERIOD OF RECORD.--October 1966 to current year.
GAGE.--Water-stage recorder, water-quality monitor, and heated tipping bucket precipitation gage. Datum of gage is 659.09 ft above North American Vertical Datum of 1988. Prior to October 28, 2022, the datum of gage was reported as 659.72 ft above National Geodetic Vertical Datum of 1929.
COOPERATION.--Funding for the operation of this station is provided by the U.S. Army Corps of Engineers, Philadelphia District, the Pennsylvania Department of Environmental Protection, and the U.S. Geological Survey.
REMARKS.--
GAGE HEIGHTS OF IMPORTANCE.-
Supplied by USGS: Data transmitter operational limit - 11.3 ft;
Supplied by NWS: No flood stage has been determined for this station.
The 15-minute precipitation data for this station are temporary and will only be displayed for 120 days. Time series of 1-hour or cumulative daily values will NOT be available for retrieval following the 120-day display period. Although the instrumentation is calibrated at least once a year, the temporary classification means that documented routine inspections and other quality assurance measures are not performed that would make the data acceptable for archival, retrieval, or future use in general scientific or interpretive studies.
This station managed by the PAWSC New Cumberland Office.

Available Parameters Available Period
  
2017-10-01  2024-04-16
2023-12-18  2024-04-16
1985-10-01  2024-04-16
2007-10-01  2024-04-16
2021-04-16  2024-04-16


 (7)
 

  -- or --


Summary of all available data for this site
Instantaneous-data availability statement


Temperature, water, degrees Celsius

Most recent instantaneous value: 12.0 04-16-2024   02:30 EDT
Graph of

Add up to 2 more sites and replot for "Temperature, water, degrees Celsius"

?


Create presentation-quality / stand-alone graph.   Subscribe to WaterAlert      

See this graph on the Monitoring Location Pages


Precipitation, total, inches

Most recent instantaneous value: 0.00 04-16-2024   02:30 EDT
Graph of

Add up to 2 more sites and replot for "Precipitation, total, inches"

?


Create presentation-quality / stand-alone graph.   Subscribe to WaterAlert      

See this graph on the Monitoring Location Pages


Discharge, cubic feet per second

Most recent instantaneous value: 189 04-16-2024   02:30 EDT
Graph of

Add up to 2 more sites and replot for "Discharge, cubic feet per second"

?


Create presentation-quality / stand-alone graph.   Subscribe to WaterAlert      

See this graph on the Monitoring Location Pages


Daily discharge, cubic feet per second -- statistics for Apr 16 based on 57 water years of record more
Min
(2012)
25th
percen-
tile
Median Mean Most Recent
Instantaneous
Value Apr 16
75th
percen-
tile
Max
(1983)
40.2 92 130 185 189 189 1550


Gage height, feet

Most recent instantaneous value: 4.16 04-16-2024   02:30 EDT
Graph of

Add up to 2 more sites and replot for "Gage height, feet"

?


Create presentation-quality / stand-alone graph.   Subscribe to WaterAlert      

See this graph on the Monitoring Location Pages


Stream water level elevation above NAVD 1988, in feet

Most recent instantaneous value: 663.25 04-16-2024   02:30 EDT
Graph of

Add up to 2 more sites and replot for "Stream water level elevation above NAVD 1988, in feet"

?


Create presentation-quality / stand-alone graph.   Subscribe to WaterAlert      

See this graph on the Monitoring Location Pages