PROVISIONAL DATA SUBJECT TO REVISION
Click to hidestation-specific text
Funding for this site is provided by:
 STATION.--01553005 MUNCY CREEK NEAR MUNCY, PA
LOCATION.--Lat 41`12'27", long 76`45'09", Lycoming County, Hydrologic Unit 02050206, 1,900 ft downstream from Little Muncy Creek, 2,300 ft upstream from bridge on State Highway 405, and 2.2 mi east of Muncy.
DRAINAGE AREA.--209 square miles.
PERIOD OF RECORD.--Water years 1989 to current year.
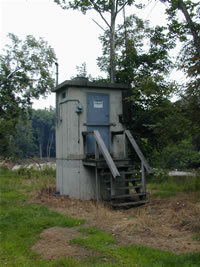
GAGE.--Water-stage recorder, crest-stage gage, and weighing bucket precipitation gage. Datum of gage is 490.00 ft above National Geodetic Vertical Datum of 1929, from topographic map. Satellite telemetry at station.
COOPERATION.--Station established and maintained by the U.S. Geological Survey. Funding for the operation of this station is provided by the Pennsylvania Department of Environmental Protection and the U.S. Geological Survey.
REMARKS.--Daily discharge not available.
| The 15-minute precipitation data for this station are temporary and will only be displayed for 120 days. Time series of 1-hour or cumulative daily values will NOT be available for retrieval following the 120-day display period. Although the instrumentation is calibrated at least once a year, the temporary classification means that documented routine inspections and other quality assurance measures are not performed that would make the data acceptable for archival, retrieval, or future use in general scientific or interpretive studies. |
GAGE HEIGHTS OF IMPORTANCE.-
Supplied by USGS: Maximum recordable gage height (stage sensor operational limit) - 23.4 ft; Data transmitter operational limit - 24.7 ft;
Supplied by NWS: Action stage-13 ft.
Summary of all available data for this site
Instantaneous-data availability statement
