USGS 01569460 Big Spring Creek at Big Spring, PA

PROVISIONAL DATA SUBJECT TO REVISION

Click to hidestation-specific text

Funding for this site is provided by:


Station gage image
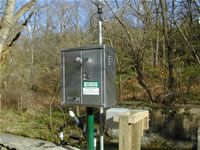
STATION.--01569460 BIG SPRING CREEK AT BIG SPRING, PA
LOCATION.--Lat 40`07'46", long 77`24'27", Cumberland County, Hydrologic Unit 02050305, on left bank, 100 ft upstream from bridge on SR 3007, at Big Spring.
DRAINAGE AREA.--undetermined. Most flow at station is from a spring, to which the contributing recharge is unknown.
PERIOD OF RECORD.--November 2004 to current year.
GAGE.--Water-stage recorder, crest-stage gage, and water-quality monitor. Elevation of gage is 510 ft National Geodetic Vertical Datum of 1929, from topographic map.
REMARKS--Abrupt temporary changes in gage height can occur from the removal and replacement of wooden boards from the I-beams in the concrete sluiceway upstream or by manmade alterations to the control. Discharge may be influenced by nearby pumping.
GAGE HEIGHTS OF IMPORTANCE.-
Supplied by USGS: Data transmitter operational limit - 10.7 ft;
Supplied by NWS: No flood stage has been determined for this station.
COOPERATION.--Station established and maintained by the U.S. Geological Survey. Funding for the operation of this station is provided by the Pennsylvania Department of Environmental Protection.
This station managed by the PAWSC New Cumberland Office.

Available Parameters Available Period
  
2004-11-06  2024-04-19
2007-10-01  2024-04-19
2007-10-01  2024-04-19


 (7)
 

  -- or --


Summary of all available data for this site
Instantaneous-data availability statement


Discharge, cubic feet per second

Most recent instantaneous value: 36.7 04-19-2024   15:00 EDT
Graph of

Add up to 2 more sites and replot for "Discharge, cubic feet per second"

?


Create presentation-quality / stand-alone graph.   Subscribe to WaterAlert      

See this graph on the Monitoring Location Pages


Daily discharge, cubic feet per second -- statistics for Apr 19 based on 19 water years of record more
Min
(2017)
25th
percen-
tile
Median Mean Most Recent
Instantaneous
Value Apr 19
75th
percen-
tile
Max
(2019)
20.6 27 30 32 36.7 37 45.1


Gage height, feet

Most recent instantaneous value: 1.12 04-19-2024   15:00 EDT
Graph of

Add up to 2 more sites and replot for "Gage height, feet"

?


Create presentation-quality / stand-alone graph.   Subscribe to WaterAlert      

See this graph on the Monitoring Location Pages


Turbidity, water, unfiltered, monochrome near infra-red LED light, 780-900 nm, detection angle 90 +-2.5 degrees, formazin nephelometric units (FNU)

Most recent instantaneous value: 0.3 04-19-2024   15:00 EDT
Graph of

Add up to 2 more sites and replot for "Turbidity, water, unfiltered, monochrome near infra-red LED light, 780-900 nm, detection angle 90 +-2.5 degrees, formazin nephelometric units (FNU)"

?


Create presentation-quality / stand-alone graph.   Subscribe to WaterAlert      

See this graph on the Monitoring Location Pages