USGS 01575900 Chiques Creek near Marietta, PA

PROVISIONAL DATA SUBJECT TO REVISION

Click to hidestation-specific text


Station gage image
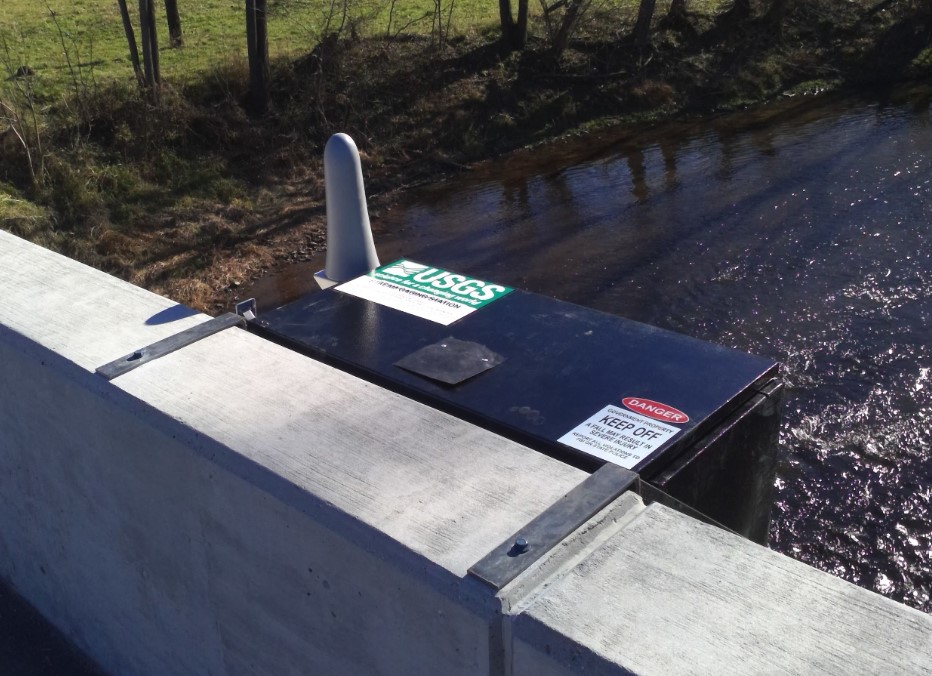
STATION.--01575900 CHIQUES CREEK NEAR MARIETTA, PA
LOCATION.--Lat 40`03'46", long 76`30'57", Lancaster County, Hydrologic Unit 02050306, at single-span concrete bridge on SR 23, 400 ft downstream from Little Chiques Creek, and 1.2 mi east of Marietta.
DRAINAGE AREA.--108 square miles.
PERIOD OF RECORD.--1989 to current year. Prior to October 2020, published as "Chickies Creek".
GAGE.--Water-stage recorder, crest-stage gage, and water-quality monitor. Datum of gage is 250 ft above National Geodetic Vertical Datum of 1929, from topographic map. April 2002 to December 2020, non-recording gage at same site and datum.
COOPERATION.--Station established and maintained by the U.S. Geological Survey. Funding for the operation of this station is provided by the Pennsylvania Department of Environmental Protection, Natural Resources Conservation Service, and the U.S. Geological Survey.
REMARKS.--There is diurnal regulation at low flow caused by operation of mill upstream.
GAGE HEIGHTS OF IMPORTANCE.-
Supplied by USGS: Data transmitter operational limit - 23 ft;
Supplied by NWS: none.
This station managed by the PAWSC New Cumberland Office.

Available Parameters Available Period
  
2021-03-04  2026-01-31
2020-12-03  2026-01-27
2020-12-03  2026-01-31
2021-03-04  2026-01-31
2021-03-04  2026-01-31
2021-03-04  2026-01-31
2021-03-05  2026-01-31
2023-01-30  2026-01-27
2023-02-01  2026-01-27
2023-01-30  2026-01-27
2023-01-30  2026-01-27
2023-01-30  2026-01-27
2023-01-30  2026-01-27
2023-02-01  2026-01-27
2021-03-05  2026-01-31
2023-01-30  2026-01-31
2023-01-30  2026-01-31
2023-02-01  2026-01-31


 (31)
 

  -- or --


Summary of all available data for this site
Instantaneous-data availability statement


Temperature, water, degrees Celsius

Most recent instantaneous value: -0.1 01-31-2026   08:15 EST
Graph of  Temperature, water, degrees Celsius

Add up to 2 more sites and replot for "Temperature, water, degrees Celsius"

?


Create presentation-quality / stand-alone graph.   Subscribe to WaterAlert      

See this graph on the Monitoring Location Pages


Discharge, cubic feet per second

Most recent instantaneous value: Ice 01-27-2026   21:45 EST
Graph of  Discharge, cubic feet per second

Add up to 2 more sites and replot for "Discharge, cubic feet per second"

?


Create presentation-quality / stand-alone graph.   Subscribe to WaterAlert      

See this graph on the Monitoring Location Pages


Gage height, feet

Most recent instantaneous value: 1.74 01-31-2026   08:15 EST
Graph of  Gage height, feet

Add up to 2 more sites and replot for "Gage height, feet"

?


Create presentation-quality / stand-alone graph.   Subscribe to WaterAlert      

See this graph on the Monitoring Location Pages


Specific conductance, water, unfiltered, microsiemens per centimeter at 25 degrees Celsius

Most recent instantaneous value: 818 01-31-2026   08:15 EST
Graph of  Specific conductance, water, unfiltered, microsiemens per centimeter at 25 degrees Celsius

Add up to 2 more sites and replot for "Specific conductance, water, unfiltered, microsiemens per centimeter at 25 degrees Celsius"

?


Create presentation-quality / stand-alone graph.   Subscribe to WaterAlert      

See this graph on the Monitoring Location Pages


Dissolved oxygen, water, unfiltered, milligrams per liter

Most recent instantaneous value: 13.4 01-31-2026   08:15 EST
Graph of  Dissolved oxygen, water, unfiltered, milligrams per liter

Add up to 2 more sites and replot for "Dissolved oxygen, water, unfiltered, milligrams per liter"

?


Create presentation-quality / stand-alone graph.   Subscribe to WaterAlert      

See this graph on the Monitoring Location Pages


pH, water, unfiltered, field, standard units

Most recent instantaneous value: 8.1 01-31-2026   08:15 EST
Graph of  pH, water, unfiltered, field, standard units

Add up to 2 more sites and replot for "pH, water, unfiltered, field, standard units"

?


Create presentation-quality / stand-alone graph.   Subscribe to WaterAlert      

See this graph on the Monitoring Location Pages


Turbidity, water, unfiltered, monochrome near infra-red LED light, 780-900 nm, detection angle 90 +-2.5 degrees, formazin nephelometric units (FNU), [Turbidity]

Most recent instantaneous value: 3.6 01-31-2026   08:15 EST
Graph of  Turbidity, water, unfiltered, monochrome near infra-red LED light, 780-900 nm, detection angle 90 +-2.5 degrees, formazin nephelometric units (FNU), [Turbidity]

Add up to 2 more sites and replot for "Turbidity, water, unfiltered, monochrome near infra-red LED light, 780-900 nm, detection angle 90 +-2.5 degrees, formazin nephelometric units (FNU), [Turbidity]"

?


Create presentation-quality / stand-alone graph.   Subscribe to WaterAlert      

See this graph on the Monitoring Location Pages


Suspended sediment load, water, unfiltered, computed by regression equation, pounds per day

Most recent instantaneous value: Ice 01-27-2026   21:45 EST
Graph of  Suspended sediment load, water, unfiltered, computed by regression equation, pounds per day

Add up to 2 more sites and replot for "Suspended sediment load, water, unfiltered, computed by regression equation, pounds per day"

?


Create presentation-quality / stand-alone graph.   Subscribe to WaterAlert      

See this graph on the Monitoring Location Pages


Total nitrogen [nitrate + nitrite + ammonia + organic-N] yield, computed by regression equation, pounds per day per square mile

Most recent instantaneous value: Ice 01-27-2026   21:45 EST
Graph of  Total nitrogen [nitrate + nitrite + ammonia + organic-N] yield, computed by regression equation, pounds per day per square mile

Add up to 2 more sites and replot for "Total nitrogen [nitrate + nitrite + ammonia + organic-N] yield, computed by regression equation, pounds per day per square mile"

?


Create presentation-quality / stand-alone graph.   Subscribe to WaterAlert      

See this graph on the Monitoring Location Pages


Phosphorus yield, computed by regression equation, pounds per day per square mile

Most recent instantaneous value: Ice 01-27-2026   21:45 EST
Graph of  Phosphorus yield, computed by regression equation, pounds per day per square mile

Add up to 2 more sites and replot for "Phosphorus yield, computed by regression equation, pounds per day per square mile"

?


Create presentation-quality / stand-alone graph.   Subscribe to WaterAlert      

See this graph on the Monitoring Location Pages


Suspended sediment yield, computed by regression equation, pounds per day per square mile

Most recent instantaneous value: Ice 01-27-2026   21:45 EST
Graph of  Suspended sediment yield, computed by regression equation, pounds per day per square mile

Add up to 2 more sites and replot for "Suspended sediment yield, computed by regression equation, pounds per day per square mile"

?


Create presentation-quality / stand-alone graph.   Subscribe to WaterAlert      

See this graph on the Monitoring Location Pages


Suspended sediment load, water, unfiltered, regression computed, turbidity and streamflow as regressors, short tons per day, [load, tons/day]

Most recent instantaneous value: Ice 01-27-2026   21:45 EST
Graph of  Suspended sediment load, water, unfiltered, regression computed, turbidity and streamflow as regressors, short tons per day, [load, tons/day]

Add up to 2 more sites and replot for "Suspended sediment load, water, unfiltered, regression computed, turbidity and streamflow as regressors, short tons per day, [load, tons/day]"

?


Create presentation-quality / stand-alone graph.   Subscribe to WaterAlert      

See this graph on the Monitoring Location Pages


Phosphorus, water, unfiltered, pounds of phosphorus per day

Most recent instantaneous value: Ice 01-27-2026   21:45 EST
Graph of  Phosphorus, water, unfiltered, pounds of phosphorus per day

Add up to 2 more sites and replot for "Phosphorus, water, unfiltered, pounds of phosphorus per day"

?


Create presentation-quality / stand-alone graph.   Subscribe to WaterAlert      

See this graph on the Monitoring Location Pages


Total nitrogen [nitrate + nitrite + ammonia + organic-N], water, unfiltered, pounds of nitrogen per day

Most recent instantaneous value: Ice 01-27-2026   21:45 EST
Graph of  Total nitrogen [nitrate + nitrite + ammonia + organic-N], water, unfiltered, pounds of nitrogen per day

Add up to 2 more sites and replot for "Total nitrogen [nitrate + nitrite + ammonia + organic-N], water, unfiltered, pounds of nitrogen per day"

?


Create presentation-quality / stand-alone graph.   Subscribe to WaterAlert      

See this graph on the Monitoring Location Pages


Nitrate plus nitrite, water, in situ, milligrams per liter as nitrogen, [Qualified]

Most recent instantaneous value: 10.4 01-31-2026   08:15 EST
Graph of  Nitrate plus nitrite, water, in situ, milligrams per liter as nitrogen, [Qualified]

Add up to 2 more sites and replot for "Nitrate plus nitrite, water, in situ, milligrams per liter as nitrogen, [Qualified]"

?


Create presentation-quality / stand-alone graph.   Subscribe to WaterAlert      

See this graph on the Monitoring Location Pages


Suspended sediment concentration, water, unfiltered, estimated by regression equation, milligrams per liter

Most recent instantaneous value: 16.4 01-31-2026   08:15 EST
Graph of  Suspended sediment concentration, water, unfiltered, estimated by regression equation, milligrams per liter

Add up to 2 more sites and replot for "Suspended sediment concentration, water, unfiltered, estimated by regression equation, milligrams per liter"

?


Create presentation-quality / stand-alone graph.   Subscribe to WaterAlert      

See this graph on the Monitoring Location Pages


Phosphorus, water, unfiltered, estimated by regression equation, milligrams per liter as phosphorus

Most recent instantaneous value: 0.053 01-31-2026   08:15 EST
Graph of  Phosphorus, water, unfiltered, estimated by regression equation, milligrams per liter as phosphorus

Add up to 2 more sites and replot for "Phosphorus, water, unfiltered, estimated by regression equation, milligrams per liter as phosphorus"

?


Create presentation-quality / stand-alone graph.   Subscribe to WaterAlert      

See this graph on the Monitoring Location Pages


Total nitrogen [nitrate + nitrite + ammonia + organic-N], water, unfiltered, estimated by regression equation, milligrams per liter as nitrogen

Most recent instantaneous value: 10 01-31-2026   08:15 EST
Graph of  Total nitrogen [nitrate + nitrite + ammonia + organic-N], water, unfiltered, estimated by regression equation, milligrams per liter as nitrogen

Add up to 2 more sites and replot for "Total nitrogen [nitrate + nitrite + ammonia + organic-N], water, unfiltered, estimated by regression equation, milligrams per liter as nitrogen"

?


Create presentation-quality / stand-alone graph.   Subscribe to WaterAlert      

See this graph on the Monitoring Location Pages