USGS 01451500 Little Lehigh Creek near Allentown, PA

PROVISIONAL DATA SUBJECT TO REVISION

Click to hidestation-specific text


Station gage imageSTATION.--01451500 LITTLE LEHIGH CREEK NEAR
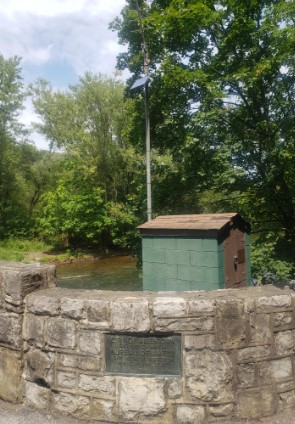
 ALLENTOWN, PA
LOCATION.--Lat 40`34'56", long 75`29'00", Lehigh County, Hydrologic Unit 02040106, on right bank at downstream side of bridge on Lehigh Parkway in Allentown, 0.8 mi upstream from Cedar Creek, and 2.9 mi upstream from mouth.
DRAINAGE AREA.--80.8 square miles.
PERIOD OF RECORD.--October 1945 to current year. Prior to October 1946, published as "at Allentown".
GAGE.--Water-stage recorder, crest-stage gage and water-quality monitor. Prior to October 14, 2013, gage included masonry control. Datum of gage is 252.71 ft above North American Vertical Datum of 1988. Prior to October 31, 2022, the datum of gage was reported as 253.41 ft above National Geodetic Vertical Datum of 1929. Satellite telemetry at station.
Low-flow gage heights will be about 2 ft less than pre-Oct, 14 2013 levels.
COOPERATION.--Station established and maintained by the U.S. Geological Survey. Funding for the operation of this station is provided by the Pennsylvania Department of Environmental Protection and the U.S. Geological Survey.
REMARKS.--Occassional slight regulation at low stages by fish hatchery upstream.
GAGE HEIGHTS OF IMPORTANCE.--
Supplied by USGS: Maximum recordable gage height (stage sensor operational limit) - 12.7 ft;
Supplied by NWS: Action stage-4 ft; Flood stage-5 ft; Moderate flood stage-8 ft; Major flood stage-10 ft.
This station managed by the PAWSC New Cumberland Office.

Available Parameters Available Period
  
2019-10-10  2024-03-18
1990-10-01  2024-03-18
2007-10-01  2024-03-18
2019-10-10  2024-03-18
2021-06-15  2024-03-18


 (7)
 

  -- or --


Summary of all available data for this site
Instantaneous-data availability statement


Temperature, water, degrees Celsius

Most recent instantaneous value: 9.4 03-18-2024   22:30 EDT
Graph of  Temperature, water, degrees Celsius

Add up to 2 more sites and replot for "Temperature, water, degrees Celsius"

?


Create presentation-quality / stand-alone graph.   Subscribe to WaterAlert      

See this graph on the Monitoring Location Pages


Discharge, cubic feet per second

Most recent instantaneous value: 168 03-18-2024   22:30 EDT
Graph of  Discharge, cubic feet per second

Add up to 2 more sites and replot for "Discharge, cubic feet per second"

?


Create presentation-quality / stand-alone graph.   Subscribe to WaterAlert      

See this graph on the Monitoring Location Pages


Daily discharge, cubic feet per second -- statistics for Mar 18 based on 78 water years of record more
Min
(1965)
25th
percen-
tile
Median Mean 75th
percen-
tile
Most Recent
Instantaneous
Value Mar 18
Max
(1972)
40.0 94 125 132 164 168 296


Gage height, feet

Most recent instantaneous value: 0.97 03-18-2024   22:30 EDT
Graph of  Gage height, feet

Add up to 2 more sites and replot for "Gage height, feet"

?


Create presentation-quality / stand-alone graph.   Subscribe to WaterAlert      

See this graph on the Monitoring Location Pages


Specific conductance, water, unfiltered, microsiemens per centimeter at 25 degrees Celsius

Most recent instantaneous value: 477 03-18-2024   22:30 EDT
Graph of  Specific conductance, water, unfiltered, microsiemens per centimeter at 25 degrees Celsius

Add up to 2 more sites and replot for "Specific conductance, water, unfiltered, microsiemens per centimeter at 25 degrees Celsius"

?


Create presentation-quality / stand-alone graph.   Subscribe to WaterAlert      

See this graph on the Monitoring Location Pages


Stream water level elevation above NAVD 1988, in feet

Most recent instantaneous value: 253.68 03-18-2024   22:30 EDT
Graph of  Stream water level elevation above NAVD 1988, in feet

Add up to 2 more sites and replot for "Stream water level elevation above NAVD 1988, in feet"

?


Create presentation-quality / stand-alone graph.   Subscribe to WaterAlert      

See this graph on the Monitoring Location Pages