PROVISIONAL DATA SUBJECT TO REVISION
Click to hidestation-specific text
Funding for this site is provided by:
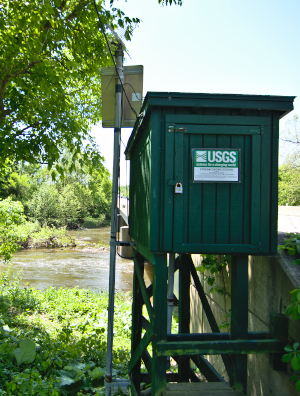 STATION.--01465200 NESHAMINY CREEK AT PENNS PARK,
PA
STATION.--01465200 NESHAMINY CREEK AT PENNS PARK,
PALOCATION.--Lat 40`15'07", long 75`00'31", Bucks County, Hydrologic Unit 02040201, on left bank at bridge over Main Stem of Neshaminy Creek on Second Street Pike (Rt 232) at Penns Park.
DRAINAGE AREA.--157 square miles.
PERIOD OF RECORD.--October 2018 to current year (continuous-record station); October 2001 to September 2018 (crest-stage partial-record station).
GAGE.--Water-stage recorder and crest-stage gage. Datum of gage is 120 ft above National Geodetic Vertical Datum of 1929, from topographic map. Satellite and landline telemetry at station.
COOPERATION.--Funding for the operation of this station is provided by the U.S. Geological Survey and the Bucks County Commissioners.
GAGE HEIGHTS OF IMPORTANCE.-
Supplied by USGS: Data transmitter operational limit: 24.7 ft, at approx 20.0 ft, low point of Rte 232 near gage affected;
Supplied by NWS: Action stage: 12 ft, at 11 ft, water begins to overflow the lowest banks into adjacent wooded areas on both sides of creek; Flood stage: 13 ft, flooding begins on Bridle Drive in Middletown Twp; at 14.5 ft, Rte 413, nr Bridgetown Pike in Middletown Twp is subject to closures due to flooding; Moderate flood stage: 16 ft, widespread flooding occurs on Bridle Drive in Middletown Twp; road becomes impassable; at 17 ft, Periwinkle Dr. in Middletown Twp begins to flood. Flooding also possible downstream in Croyden section of Bristol Twp; Major flood stage: 18 ft, residential properties are flooded on Bridle Drive. Flooding also occurs on Business US 1 in Middletown Twp nr Rising Sun Ave. Flooding also possible further downstream in the Croyden section of Bristol Twp, especially when Delaware River tides are high.
Summary of all available data for this site
Instantaneous-data availability statement

