USGS 01544500 Kettle Creek at Cross Fork, PA

PROVISIONAL DATA SUBJECT TO REVISION

Click to hidestation-specific text


Station gage imageSTATION.--01544500 KETTLE CREEK AT CROSS FORK, PA
LOCATION.--Lat 41`28'33", long 77`49'34", Clinton County, Hydrologic Unit 02050203, on right bank just upstream from abutment of former highway bridge on Township Route 318, 0.2 mi downstream from Potter-Clinton County line, and 0.7 mi southeast of Cross Fork.
DRAINAGE AREA.--136 square miles.
PERIOD OF RECORD.--October 1940 to current year.
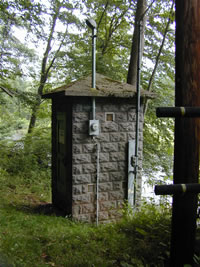
GAGE.--Water-stage recorder, crest-stage gage, and water-quality monitor. Datum of gage is 1,027.12 ft above National Geodetic Vertical Datum of 1929. Satellite and landline telemetry at station.
COOPERATION.--Station established and maintained by the U.S. Geological Survey. Funding for the operation of this station is provided by the U.S. Army Corps of Engineers, Baltimore District, the Pennsylvania Department of Environmental Protection, and the U.S. Geological Survey.
GAGE HEIGHTS OF IMPORTANCE.-
Supplied by USGS: Data transmitter operational limit - 16.4 ft;
Supplied by NWS: No flood stage has been determined for this station.
This station managed by the PAWSC Williamsport Field Office.

Available Parameters Available Period
  
2010-11-11  2024-04-19
1986-10-22  2024-04-19
2007-10-01  2024-04-19
2010-11-11  2024-04-19
2011-03-30  2024-04-19
2011-03-30  2024-04-19


 (7)
 

  -- or --


Summary of all available data for this site
Instantaneous-data availability statement


Temperature, water, degrees Celsius

Most recent instantaneous value: 9.3 04-19-2024   13:00 EDT
Graph of

Add up to 2 more sites and replot for "Temperature, water, degrees Celsius"

?


Create presentation-quality / stand-alone graph.   Subscribe to WaterAlert      

See this graph on the Monitoring Location Pages


Discharge, cubic feet per second

Most recent instantaneous value: 371 04-19-2024   13:00 EDT
Graph of

Add up to 2 more sites and replot for "Discharge, cubic feet per second"

?


Create presentation-quality / stand-alone graph.   Subscribe to WaterAlert      

See this graph on the Monitoring Location Pages


Daily discharge, cubic feet per second -- statistics for Apr 19 based on 83 water years of record more
Min
(2012)
25th
percen-
tile
Median Most Recent
Instantaneous
Value Apr 19
Mean 75th
percen-
tile
Max
(1986)
54.9 198 342 371 388 488 1150


Gage height, feet

Most recent instantaneous value: 1.86 04-19-2024   13:00 EDT
Graph of

Add up to 2 more sites and replot for "Gage height, feet"

?


Create presentation-quality / stand-alone graph.   Subscribe to WaterAlert      

See this graph on the Monitoring Location Pages


Specific conductance, water, unfiltered, microsiemens per centimeter at 25 degrees Celsius

Most recent instantaneous value: 41 04-19-2024   13:00 EDT
Graph of

Add up to 2 more sites and replot for "Specific conductance, water, unfiltered, microsiemens per centimeter at 25 degrees Celsius"

?


Create presentation-quality / stand-alone graph.   Subscribe to WaterAlert      

See this graph on the Monitoring Location Pages


Dissolved oxygen, water, unfiltered, milligrams per liter

Most recent instantaneous value: 11.9 04-19-2024   13:00 EDT
Graph of

Add up to 2 more sites and replot for "Dissolved oxygen, water, unfiltered, milligrams per liter"

?


Create presentation-quality / stand-alone graph.   Subscribe to WaterAlert      

See this graph on the Monitoring Location Pages


pH, water, unfiltered, field, standard units

Most recent instantaneous value: 7.3 04-19-2024   13:00 EDT
Graph of

Add up to 2 more sites and replot for "pH, water, unfiltered, field, standard units"

?


Create presentation-quality / stand-alone graph.   Subscribe to WaterAlert      

See this graph on the Monitoring Location Pages