PROVISIONAL DATA SUBJECT TO REVISION
Click to hidestation-specific text
Funding for this site is provided by:
 STATION.--01565000 KISHACOQUILLAS CREEK AT
REEDSVILLE, PA
STATION.--01565000 KISHACOQUILLAS CREEK AT
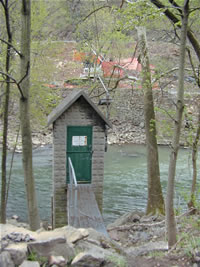
REEDSVILLE, PA LOCATION.--Lat 40`39'17", long 77`35'00", Mifflin County, Hydrologic Unit 02050304, on left bank 150 ft downstream from bridge on old U.S. Highway 322, and 1.0 mi southeast of Reedsville.
DRAINAGE AREA.--164 square miles.
PERIOD OF RECORD.--October 2001 to current year. October 1939 to September 1970, monthly discharge only for October, November 1939, published in WSP 1302; October 1983 to September 1985; October 1988 to September 2001, crest-stage partial-record station.
GAGE.--Water-stage recorder and crest-stage gage. Datum of gage is 551.23 ft above National Geodetic Vertical Datum of 1929.
COOPERATION.--Station established and maintained by the U.S. Geological Survey in cooperation with the Pennsylvania Department of Environmental Protection.
REMARKS.--There is some regulation by mills upstream.
GAGE HEIGHTS OF IMPORTANCE.-
Supplied by USGS: Maximum recordable gage height (stage sensor operational limit) - 17.2 ft;
Supplied by NWS: No flood stage has been determined for this station.
Summary of all available data for this site
Instantaneous-data availability statement

