Warning: Javascript must be enabled to use all the features on this page!

Warning: Javascript must be enabled to use all the features on this page!

Warning: Javascript must be enabled to use all the features on this page!

Warning: Javascript must be enabled to use all the features on this page!

  USGS Water Resources    


News - updated May 28,2013 RSS icon

Page Loading - Please Wait...


USGS 01575500 Codorus Creek near York, PA


PROVISIONAL DATA SUBJECT TO REVISION


Station gage image
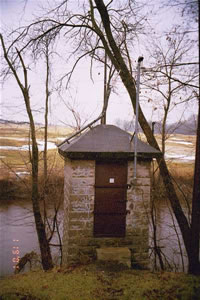
STATION.--01575500 CODORUS CREEK NEAR YORK, PA
LOCATION.--Lat 39`56'46", long 76`45'20", York County, Hydrologic Unit 02050306, on left bank 0.5 mi upstream from bridge on Richland Avenue (SR 3054), 2.0 mi downstream from South Branch Codorus Creek, and 2.0 mi southwest of York.
DRAINAGE AREA.--222 mi2.
PERIOD OF RECORD.--August 1940 to current year. October 1915 to August 1923, and August 1926 to September 1932 (gage heights and discharge measurements only), in reports of Pennsylvania Department of Forests and Waters. Published as "at York" 1915-32.
GAGE.--Water-stage recorder. Datum of gage is 356.39 ft above National Geodetic Vertical Datum of 1929 (U.S. Army Corps of Engineers bench mark). Prior to Sept. 30, 1932, nonrecording gage at site 1.6 mi downstream at different datum.
GAGE HEIGHTS OF IMPORTANCE.-
Supplied by USGS: Maximum recordable gage height (stage sensor operational limit) - 24.5 ft; Data transmitter operational limit - 25.4 ft.
Supplied by NWS: No flood stage has been determined for this station.
REMARKS.--Daily discharge not available.
COOPERATION.--Records of diversion provided by York Water Co. from 1940 to 1996. Funding for the operation of this station is provided by the U.S. Army Corps of Engineers, Baltimore District. This station managed by the New Cumberland WSC.


Available Parameters Available Period
All 2 Available Parameters for this site
  
00060 Discharge 2007-10-01  2013-06-19
00065 Gage height 2013-02-19  2013-06-19

Graph
Graph w/ stats
Graph w/o stats
Graph w/ (up to 3) parmsNew
Table
Tab-separated
Days  (7)
 

  -- or --
Begin date
 

End date


Summary of all available data for this site
  Instantaneous-data availability statement

Discharge, cubic feet per second
Most recent instantaneous value: 469   06-19-2013  03:00 EDT
Graph of  Discharge, cubic feet per second    
Create presentation-quality / stand-alone graph.   Subscribe to WaterAlert Introduction page WaterAlert      


Daily discharge, cubic feet per second -- statistics for Jun 19 based on 56 years of record more
Min
(1962)
25th
percen-
tile
Median Mean 75th
percen-
tile
Most Recent
Instantaneous
Value Jun 19
Max
(1984)
33 80. 124 172 181 469 975

Gage height, feet
Most recent instantaneous value: 3.61   06-19-2013  03:00 EDT
Graph of  Gage height, feet    
Create presentation-quality / stand-alone graph.   Subscribe to WaterAlert Introduction page WaterAlert      


Questions about sites/data? Data Tips
Feedback on this web site Explanation of terms
Automated retrievals Subscribe for system changes
Help News

Accessibility Plug-Ins FOIA Privacy Policies and Notices

Take Pride in America logo USA.gov logo U.S. Department of the Interior | U.S. Geological Survey
Title: USGS Current Conditions for the Nation
URL: http://waterdata.usgs.gov/nwis/uv?

Page Contact Information: Pennsylvania Water Data Support Team
Page Last Modified: 2013-06-19 03:51:54 EDT
0.9   0.81 sdww02