PROVISIONAL DATA SUBJECT TO REVISION
Click to hidestation-specific text
Funding for this site is provided by:
 Site Information
LOCATION.--Lat 42°51'52.9", long
78°17'00.3" referenced to North American Datum of
1983, Wyoming County, NY, Hydrologic Unit 04120104, on right
bank behind village hall and fire station, 150 ft downstream
from bridge on State Highway 238 (Main Street) at Attica and
0.4 mi upstream from Tannery Creek.
DRAINAGE AREA.--76.9 mi².
PERIOD OF RECORD.--October 1977 to current year.
REVISIONS HISTORY.--WDR NY-79-1: 1978 (M). WDR NY-82-3: Drainage area. WDR-US-2014: 1979 (M).
GAGE.--Water-stage recorder, crest-stage gage, and concrete control. Datum of gage is 954.63 ft above NGVD of 1929 and 954.10 ft above NAVD of 1988.
REMARKS.--Water Years 2014-17: Records good except those for estimated daily discharges, which are fair. Water Years 2018-23: Records good except those for estimated daily discharges, which are poor.
EXTREMES FOR PERIOD OF RECORD.--Maximum discharge, 9,400 ft³/s, July 8, 1998, gage height, 12.71 ft, from floodmark, from rating curve extended above 4,600 ft³/s on basis of flow-over-weir measurement of peak flow at gage height 9.10 ft; minimum discharge, 3.1 ft³/s, Aug. 26, Sept. 7, 1995; minimum gage height, 3.21 ft, Sept. 8, 2016.
EXTREMES OUTSIDE PERIOD OF RECORD.--Maximum discharge, about 6,000 ft³/s, June 23, 1972, gage height, about 12.0 ft, from information provided by Village of Attica.
 WaterAlert – get an
email or text (SMS) alert based on your chosen threshold.
WaterAlert – get an
email or text (SMS) alert based on your chosen threshold.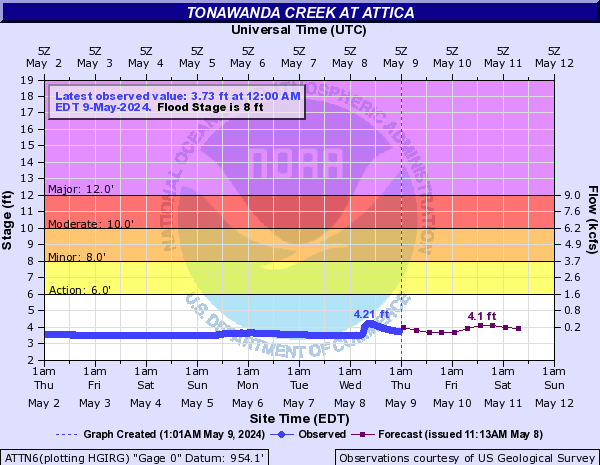
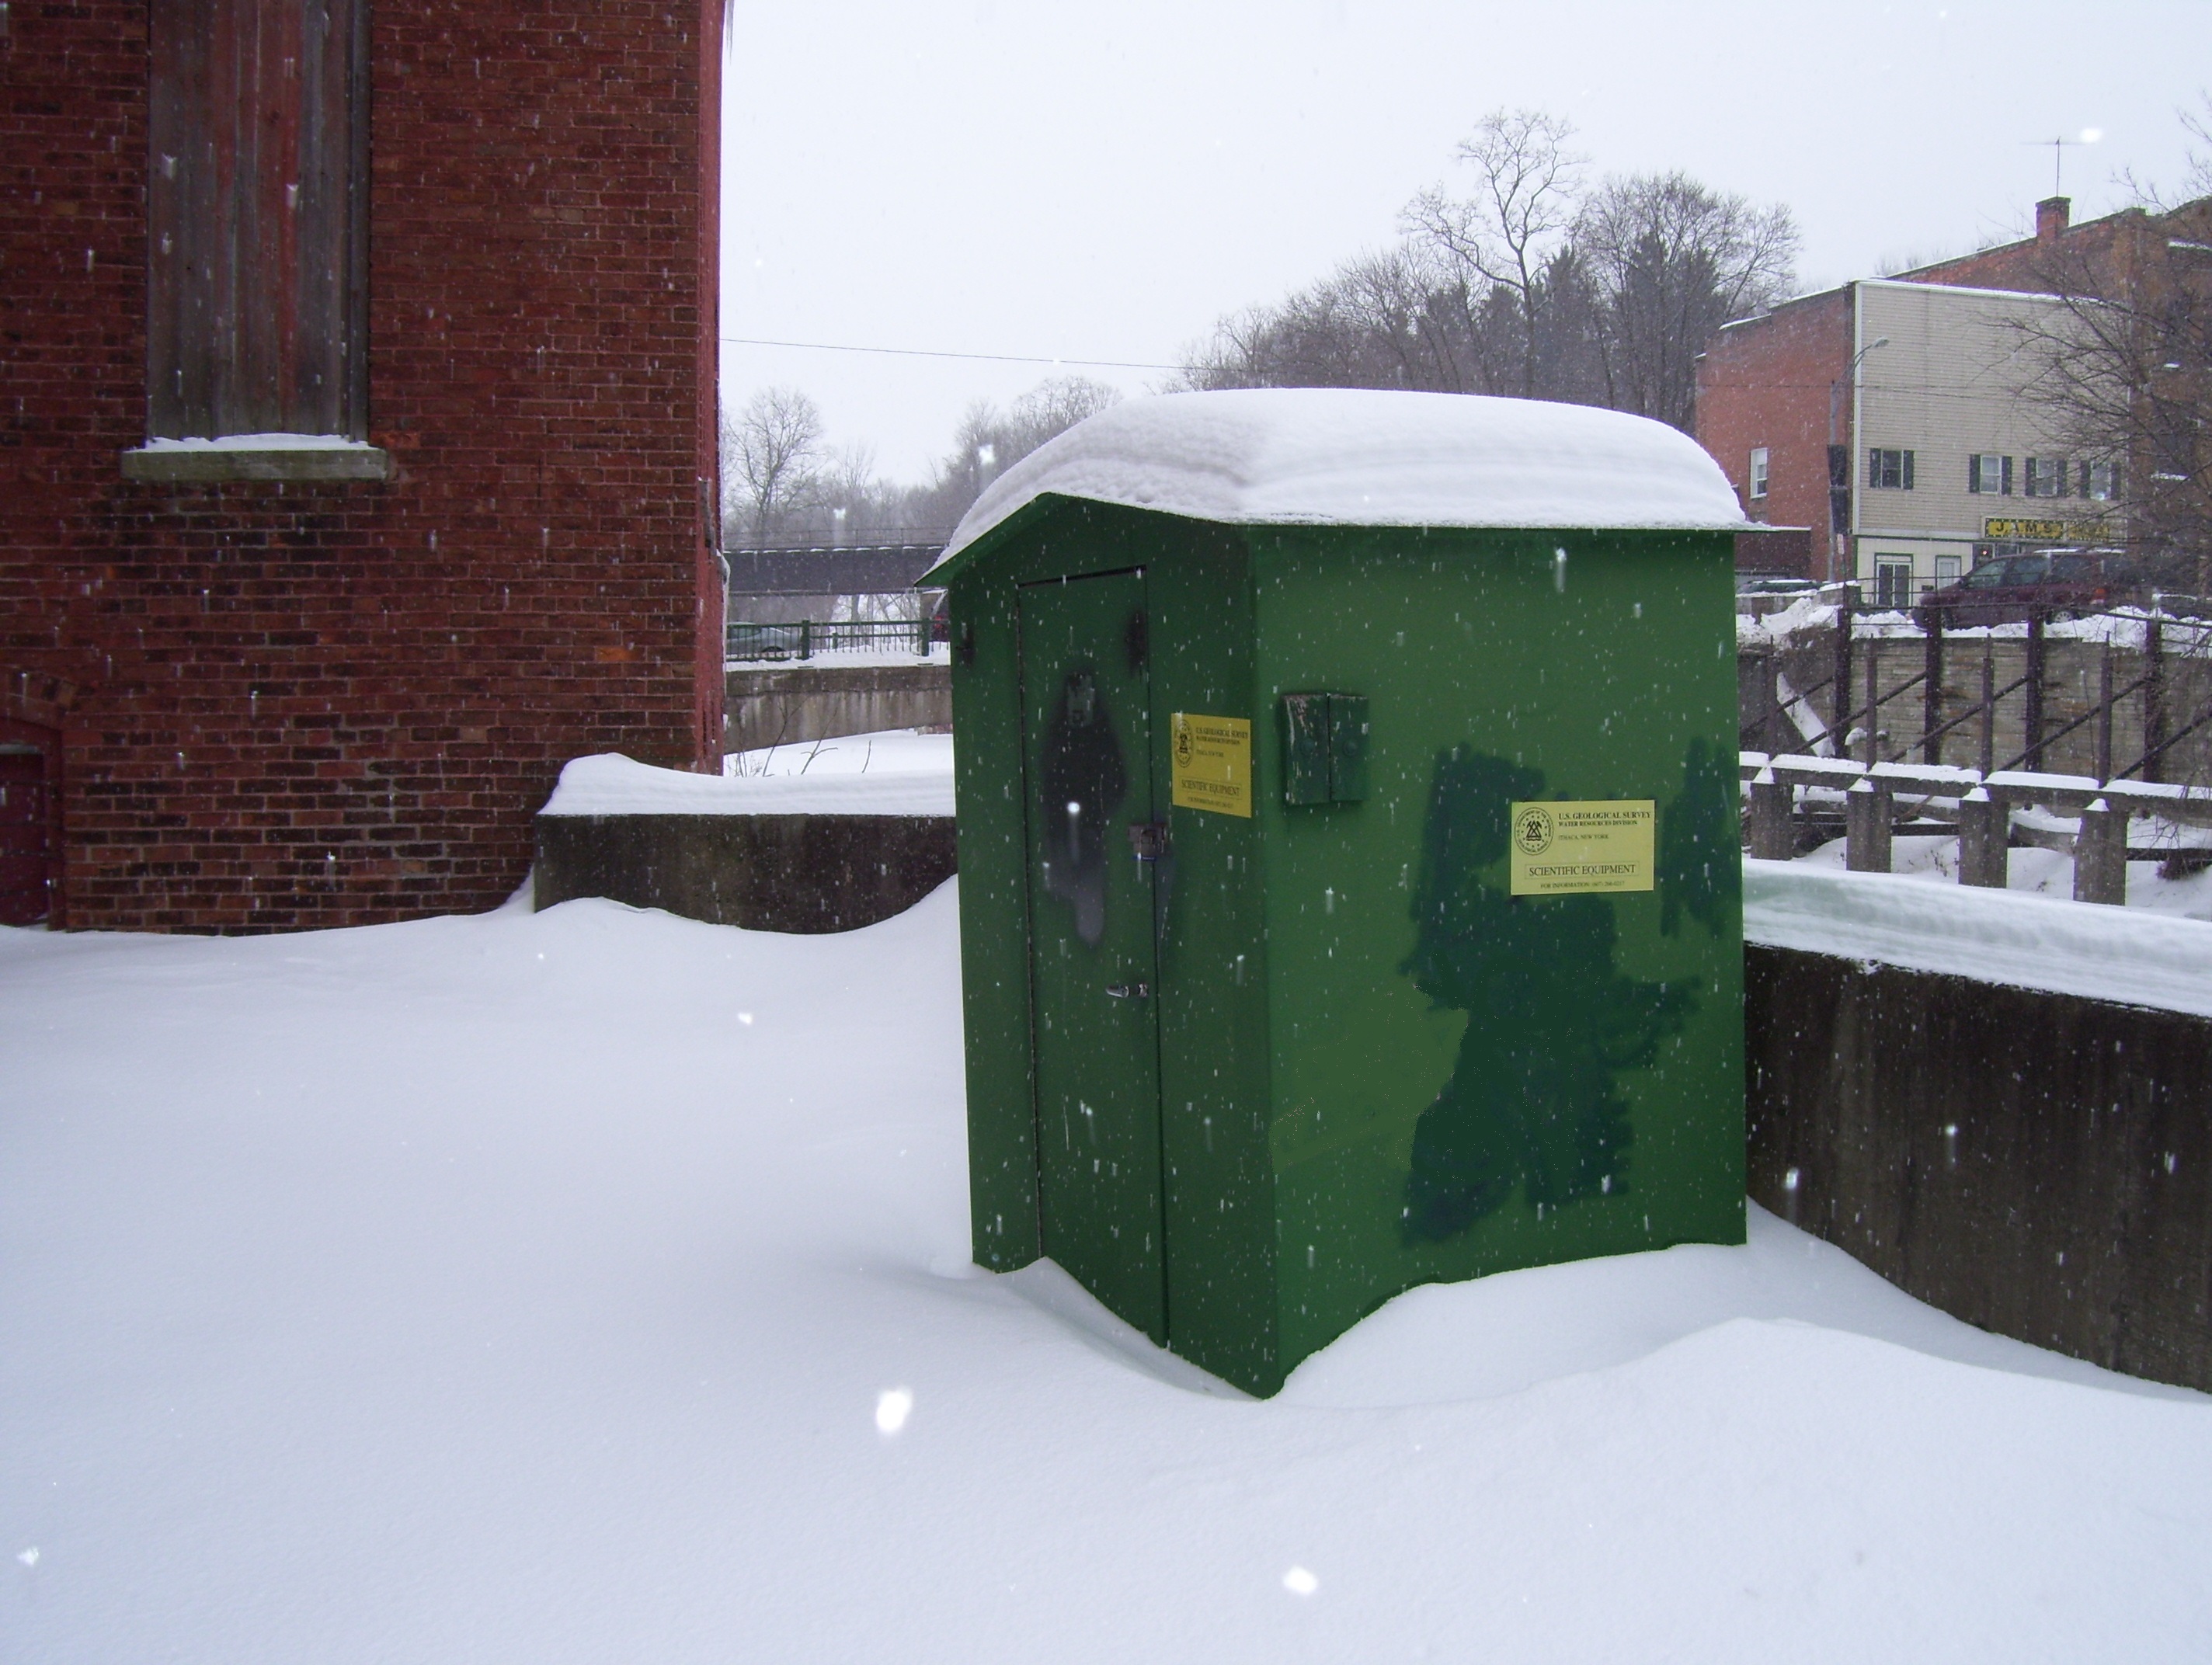 Station image
Summary of all available data for this site
Instantaneous-data availability statement

