PROVISIONAL DATA SUBJECT TO REVISION
Click to hidestation-specific text
Funding for this site is provided by:
 Site Information
LOCATION.--Lat 43°27'06", long
76°30'19" referenced to North American Datum of 1983,
Oswego County, NY, Hydrologic Unit 04140203, on right bank at
New York State Oswego (Barge) Canal Lock 7 in Oswego, 0.8 mi
upstream from mouth.
DRAINAGE AREA.--5,100 mi².
PERIOD OF RECORD.--October 1900 to April 1906, October 1933 to current year. Monthly discharge only for some periods, published in WSP 1307. Prior to January 1904, published as "above Minetto" or "near Minetto." January 1904 to April 1906, published as "at Battle Island." Records for April 1897 to September 1900, published in WSP 65 and for October 1927 to September 1928, published in WSP 644, have been found to be unreliable and should not be used.
REVISIONS HISTORY.--WDR NY 78-1: Drainage area.
GAGE.--Water-stage recorder and crest-stage gage. Datum of gage is 245.12 ft above NGVD of 1929 and 244.47 ft above NAVD of 1988. Prior to October 1933, nonrecording gage at site about 6 mi upstream at different datum.
COOPERATION.--Records of lockages at Lock 7 provided by New York State Canal Corporation, records of elevations of Lake Ontario provided by U.S. Army Corps of Engineers, and records of daily discharges for Oswego River High Dam upstream provided by Niagara Mohawk Power Corp.
REMARKS.--Prior to 1933 and subsequent to 1972, flow in Oswego (Barge) Canal not included. A large amount of natural storage and some artificial regulation is afforded by the many large lakes and the Erie (Barge) and Oswego (Barge) Canal systems in the river basin. Large diurnal fluctuations at low and medium flow caused by powerplants upstream from station. Oswego River basin receives water from Erie (Barge) Canal through Lock 32 near Pittsford. Water may be diverted into or received from Mohawk River basin through summit level of Erie (Barge) Canal between New London and Utica. Nearly all of the flow from 14 mi² of the Tioughnioga River basin may be diverted into De Ruyter Reservoir in Oswego River basin. From 1931-98, a large part of flow from 45.5 mi² of Mud Creek drainage area (Susquehanna River basin) had been diverted into Keuka Lake (Oswego River basin) for power generation. Stage-discharge relation affected by backwater during high elevations of Lake Ontario.
Water Years 2014-17: Records good except those for estimated daily discharges, which are fair. Water Year 2018: Records good except those for estimated daily discharges, which are poor. Water Years 2019-23: Records fair except those for estimated daily discharges, which are poor.
EXTREMES FOR PERIOD OF RECORD.--Maximum discharge, 37,500 ft³/s, Mar. 28, 1936, includes daily mean discharge of canals; maximum gage height, 13.46 ft, Apr. 10, 1940; minimum discharge (river only), 30 ft³/s, Nov. 6, 1944.
PERIOD OF DAILY RECORD1.-- WATER TEMPERATURE: December 2010 to current year. SPECIFIC CONDUCTANCE: December 2010 to current year. pH: December 2010 to current year. DISSOLVED OXYGEN: December 2010 to current year. TURBIDITY: December 2010 to current year.
INSTRUMENTATION1.--Refrigerated automatic sampler since July 2010. Multi-parameter water-quality sonde measures water temperature, specific conductance, pH, dissolved oxygen, and turbidity at 15-minute intervals since December 2010.
COOPERATION1.--In cooperation with the U.S. Environmental Protection Agency's Great Lakes Restoration Initiative (GLRI).
REMARKS1.--Turbidity record is subject to low-end adjustments when values are below zero. On days of missing record or instrument malfunction, 0.0 FNU may have occurred.
EXTREMES FOR PERIOD OF DAILY RECORD1.--
WATER TEMPERATURE: Maximum, 30.2°C, July 16, 2018; minimum, -0.1°C, on several days during winter periods.
SPECIFIC CONDUCTANCE: Maximum, 1,080 uS/cm @ 25°C, Feb. 20, 2011; minimum, 388 uS/cm @ 25°C, May 2, 2011.
pH: Maximum, 9.2, on several days; minimum, 7.3, Jun. 28, 2012.
DISSOLVED OXYGEN: Maximum, 16.6 mg/L, Jan. 15, 2018; minimum, 3.3 mg/L, Aug. 6, 2012.
TURBIDITY: Maximum, 62 FNU, Sept. 7, 2011; minimum, 0.0 FNU, Sept. 14, 2012 [0.0 FNU may have occurred on days of missing record or instrument malfunction].
1 Water-Quality Records
 WaterAlert – get an
email or text (SMS) alert based on your chosen threshold.
WaterAlert – get an
email or text (SMS) alert based on your chosen threshold.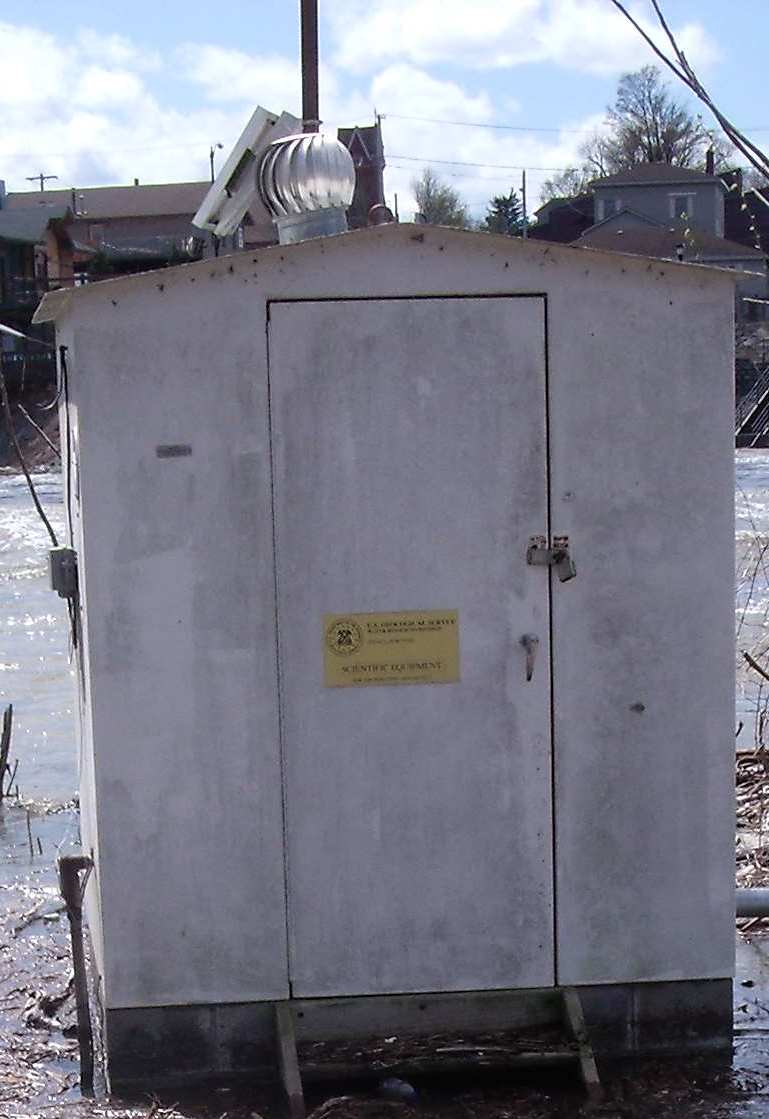 Station image
Summary of all available data for this site
Instantaneous-data availability statement


