PROVISIONAL DATA SUBJECT TO REVISION
Click to hidestation-specific text
The elevation of this station has been determined to be 2175.514 feet above NAVD88. To obtain stream water-surface elevation values in NAVD88 add 2175.514 feet to gage height values.
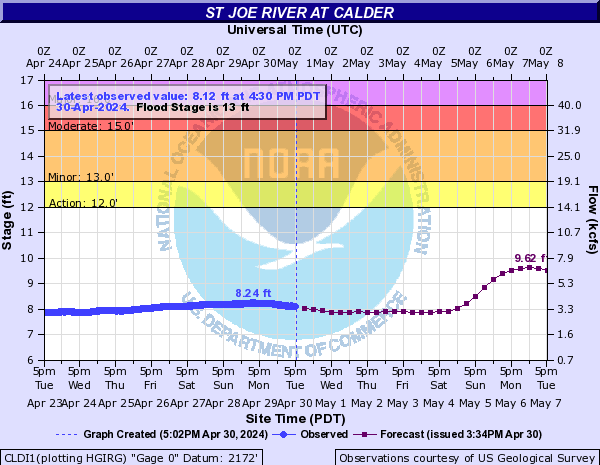
 NWS River Forecast for this
site
NWS River Forecast for this
site

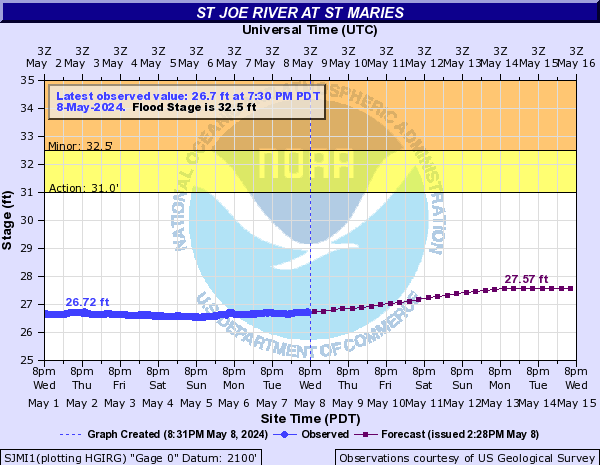
NWS River Forecast for St. Joe River at St.
Maries
Station operated in cooperation with Bonneville Power Administration.
Summary of all available data for this site
Instantaneous-data availability statement

