USGS Water Resources    


News - updated November 2009

USGS 13042500 HENRYS FORK NR ISLAND PARK ID


PROVISIONAL DATA SUBJECT TO REVISION

 
  Henrys Fork near Island Park, ID - USGS file photo
LOCATION.--Lat 44° 25'00", long 111° 23'41" (NAD83), in SW1/4 SW1/4 sec.28, 
   T.13 N., R.43 E., Fremont County, Hydrologic Unit 17040202, Island Park Dam quad., 
   Targhee National Forest, on left bank 0.2 mi downstream from Island Park Dam, 
   0.2 mi upstream from Buffalo River, 1 mi southwest of Island Park Post Office, 
   and at mile 91.5.

DRAINAGE AREA.--481 mi2. Mean elevation, 7,080 ft.

PERIOD OF RECORD.--January 1933 to current year.

REVISED RECORDS.--WSP 1217: Drainage area. 

GAGE.--Elevation of gage is 6,225 ft above NGVD of 1929, from river-profile map. 
   Prior to May 15, 1935, non-recording gage at site about 0.8 mi upstream at 
   different datum. May 15 to Nov. 30, 1935, water-stage recorder at site 
   1,000 ft downstream at different datum.

REMARKS.--Flow regulated by Henrys Lake (see sta 13039000) and Island Park 
   Reservoir. Diversions above station for irrigation of about 15,500 acres 
   (1966 determination), a considerable part of which consists of partly 
   subirrigated meadows.

EXTREMES FOR PERIOD OF RECORD.--Maximum discharge, 3,030 ft3/s May 23, 1984, 
   gage height, 6.06 ft; minimum daily, 1.0 ft3/s Nov. 16 to Dec. 7, 1938.
(Button) Current shift-adjusted rating in tab-separated format.
These are updated daily and can change often! If you use these ratings it is important that you update often so that you have the most current version.
What is a shift-adjusted rating?

(Button) River forecasts and additional data are available at the National Weather Service Advanced Hydrologic Prediction Services web page.

Station operated in cooperation with U.S. Bureau of Reclamation.

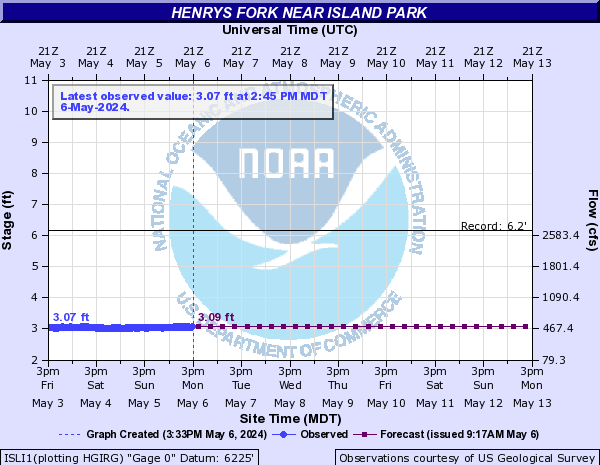
Realtime Gage Height data is provided by U.S. Bureau of Reclamation telemetry.


Available Parameters
All 2 Available Parameters for this site
00060 Discharge
00065 Gage height

Graph
Graph w/ stats
Graph w/o stats
Table
Tab-separated
Days

 (1-60)
 

Summary of all available data for this site

Discharge, cubic feet per second
Most recent instantaneous value: 207   11-23-2009  12:45 MST
Graph of  Discharge, cubic feet per second    
Create presentation-quality / stand-alone graph parm 00060 DD01
Daily discharge statistics, in cfs, for Nov 23 based on 75 years of record more
Min
(1939)
20th
percen-
tile
Median Most Recent
Instantaneous
Value
Mean 80th
percen-
tile
Max
(1972)
1.0 7.0 129 207 229 442 902

Gage height, feet
Most recent instantaneous value: 2.68   11-23-2009  12:45 MST
Graph of  Gage height, feet    
Create presentation-quality / stand-alone graph parm 00065 DD02

Questions about sites/data? Top
Feedback on this web site Explanation of terms
Automated retrievals Subscribe for system changes
Help News

Accessibility FOIA Privacy Policies and Notices

Take Pride in America logo USA.gov logo U.S. Department of the Interior | U.S. Geological Survey
Title: USGS Real-Time Water Data for the Nation
URL: http://waterdata.usgs.gov/nwis/uv?

Page Contact Information: Idaho Water-Data Support Team
Page Last Modified: 2009-11-23 15:57:26 EST
1.54   1.43 ca02