USGS Water Resources    


News - updated November 2009

USGS 13247500 PAYETTE RIVER NR HORSESHOE BEND ID


PROVISIONAL DATA SUBJECT TO REVISION

 
  Payette River near Horseshoe Bend, ID - USGS file photo
LOCATION.--Lat 43° 56'36", long 116° 11'48" (NAD83), in NE1/4 SE1/4 
   sec.15, T.7 N., R.2 E., Boise County, Horseshoe Bend quad., Hydrologic Unit 
   17050122, on left bank 0.5 mi downstream from Porter Creek, 0.6 mi upstream 
   from concrete highway bridge on State Highway 55, 2 mi north of Horseshoe Bend, 
   and at mile 60.8.

DRAINAGE AREA.--2,220 mi2. Mean elevation, 5,880 ft.

PERIOD OF RECORD.--February 1906 to September 1916, July 1919 to current year. 
   Monthly discharge only for some periods, published in WSP 1317.

REVISED RECORDS.--WDR ID-04-2: Drainage area.

GAGE.--Water-stage recorder. Datum of gage is 2,625.61 ft above NGVD of 1929. 
   Prior to Nov. 23, 1912, nonrecording gage at site 1.8 mi upstream at different 
   datum. Nov. 23, 1912 to Apr. 16, 1953, water-stage recorder at site 1,000 ft 
   downstream at datum 2.1 ft lower.

REMARKS.--Flow regulated by Deadwood Reservoir beginning November 1930,
   Cascade Reservoir, 51.9 mi upstream, beginning November 1947 and other 
   reservoirs upstream. Diversions above station for irrigation of about 
   55,100 acres (1966 determination).

EXTREMES FOR PERIOD OF RECORD.--Maximum discharge, 27,000 ft3/s Dec. 23, 1964,  
   gage height, 16.35 ft; minimum daily, 260 ft3/s Nov. 14, 1979.
(Button) Current shift-adjusted rating in tab-separated format.
These are updated daily and can change often! If you use these ratings it is important that you update often so that you have the most current version.
What is a shift-adjusted rating?

(Button) River forecasts and additional data are available at the National Weather Service Advanced Hydrologic Prediction Services web page.

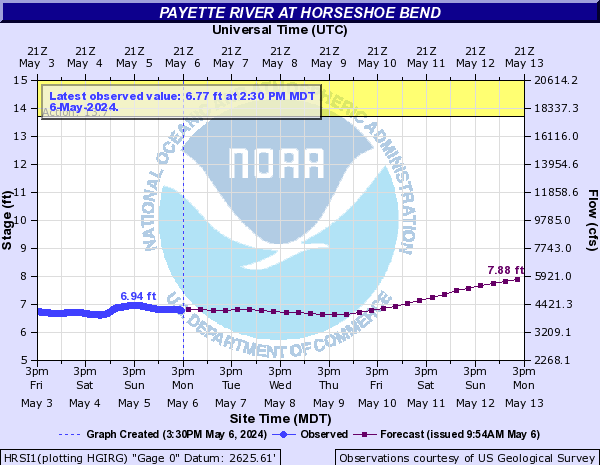
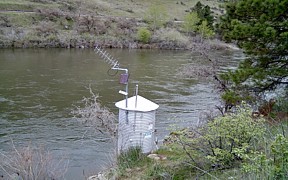
Station operated in cooperation with U.S. Bureau of Reclamation and Idaho Department of Water Resources.

Realtime Gage Height data is provided by U.S. Bureau of Reclamation telemetry.


Available Parameters
All 2 Available Parameters for this site
00060 Discharge
00065 Gage height

Graph
Graph w/ stats
Graph w/o stats
Table
Tab-separated
Days

 (1-60)
 

Summary of all available data for this site

Discharge, cubic feet per second
Most recent instantaneous value: 1,000   11-22-2009  16:30 MST
Graph of  Discharge, cubic feet per second    
Create presentation-quality / stand-alone graph parm 00060 DD02
Daily discharge statistics, in cfs, for Nov 22 based on 100 years of record more
Min
(1932)
20th
percen-
tile
Most Recent
Instantaneous
Value
Median Mean 80th
percen-
tile
Max
(1910)
450 836 1,000 1160 1350 1680 8230

Gage height, feet
Most recent instantaneous value: 3.20   11-22-2009  16:30 MST
Graph of  Gage height, feet    
Create presentation-quality / stand-alone graph parm 00065 DD03

Questions about sites/data? Top
Feedback on this web site Explanation of terms
Automated retrievals Subscribe for system changes
Help News

Accessibility FOIA Privacy Policies and Notices

Take Pride in America logo USA.gov logo U.S. Department of the Interior | U.S. Geological Survey
Title: USGS Real-Time Water Data for the Nation
URL: http://waterdata.usgs.gov/nwis/uv?

Page Contact Information: Idaho Water-Data Support Team
Page Last Modified: 2009-11-22 19:28:15 EST
1.46   1.4 ca02