PROVISIONAL DATA SUBJECT TO REVISION
Click to hidestation-specific text
Funding for this site is provided by:
 Site Information
LOCATION.--Lat 42°49'45", long
73°39'58" referenced to North American Datum of 1983,
Saratoga County, NY, Hydrologic Unit 02020003, 0.4 mi upstream
from dam at Lock 1 of the Champlain (Barge) Canal, 2.8 mi
northeast of Waterford, and 3.4 mi downstream from dam at Lock
2 of the Champlain (Barge) Canal.
DRAINAGE AREA.--4,605 mi².
PERIOD OF RECORD.--October 1887 to September 1956, October 1976 to current year. Prior to October 1976, published as "at Mechanicville" (station 01335500, drainage area 4,500 mi²). Daily discharge records from October 1976 to September 1981 are published with suspended-sediment data as Hudson River at Waterford (station 01335770).
REVISIONS HISTORY.--WDR NY-99-1: 1998.
GAGE.--Water-stage recorder and crest-stage gage. Since Oct. 1, 1998, supplementary water-stage and taintor gate-position recorders, 0.4 mi downstream at dam at Lock 1. Since Dec. 15, 2016, total flow does not include flow through Lock 1. Datum of gage is NGVD of 1929. To convert to NAVD of 1988, subtract 0.72 ft. Prior to October 1976, various gages at site 5.8 mi upstream at different datum. October 1976 to January 1978, nonrecording gage 200 ft downstream.
REMARKS.--Flow regulated by Indian Lake (station 01314500) since 1898 and by Great Sacandaga Lake (station 01323500) since March 1930. Diurnal fluctuation caused by powerplants upstream from station. Water is diverted into St. Lawrence River basin through Glens Falls feeder, Bond Creek, and Champlain (Barge) Canal, and occasionally may be received from that basin through summit level of Champlain (Barge) Canal at Dunham Basin. Water-discharge data for July 1992 through May 1994 based on records for Hudson River at Stillwater (station 01331095) and Hoosic River near Eagle Bridge (station 01334500) due to reconstruction of dam at Lock 1.
Water Year 2015: Records poor. Water Years 2014, 2016-24: Records fair except those for estimated daily discharges, which are poor.
EXTREMES FOR PERIOD OF RECORD.--Maximum discharge, since construction of Great Sacandaga Lake in 1930, 118,000 ft³/s, Jan. 1, 1949; maximum gage height, 36.38 ft, May 30, 31, 1984; minimum daily discharge, 614 ft³/s, Feb. 1, 1931; minimum instantaneous discharge not determined.
EXTREMES FOR PERIOD PRIOR TO REGULATION.--Maximum discharge, prior to construction of Great Sacandaga Lake in 1930, 120,000 ft³/s, Mar. 28, 1913.
 WaterAlert – get an
email or text (SMS) alert based on your chosen threshold.
WaterAlert – get an
email or text (SMS) alert based on your chosen threshold.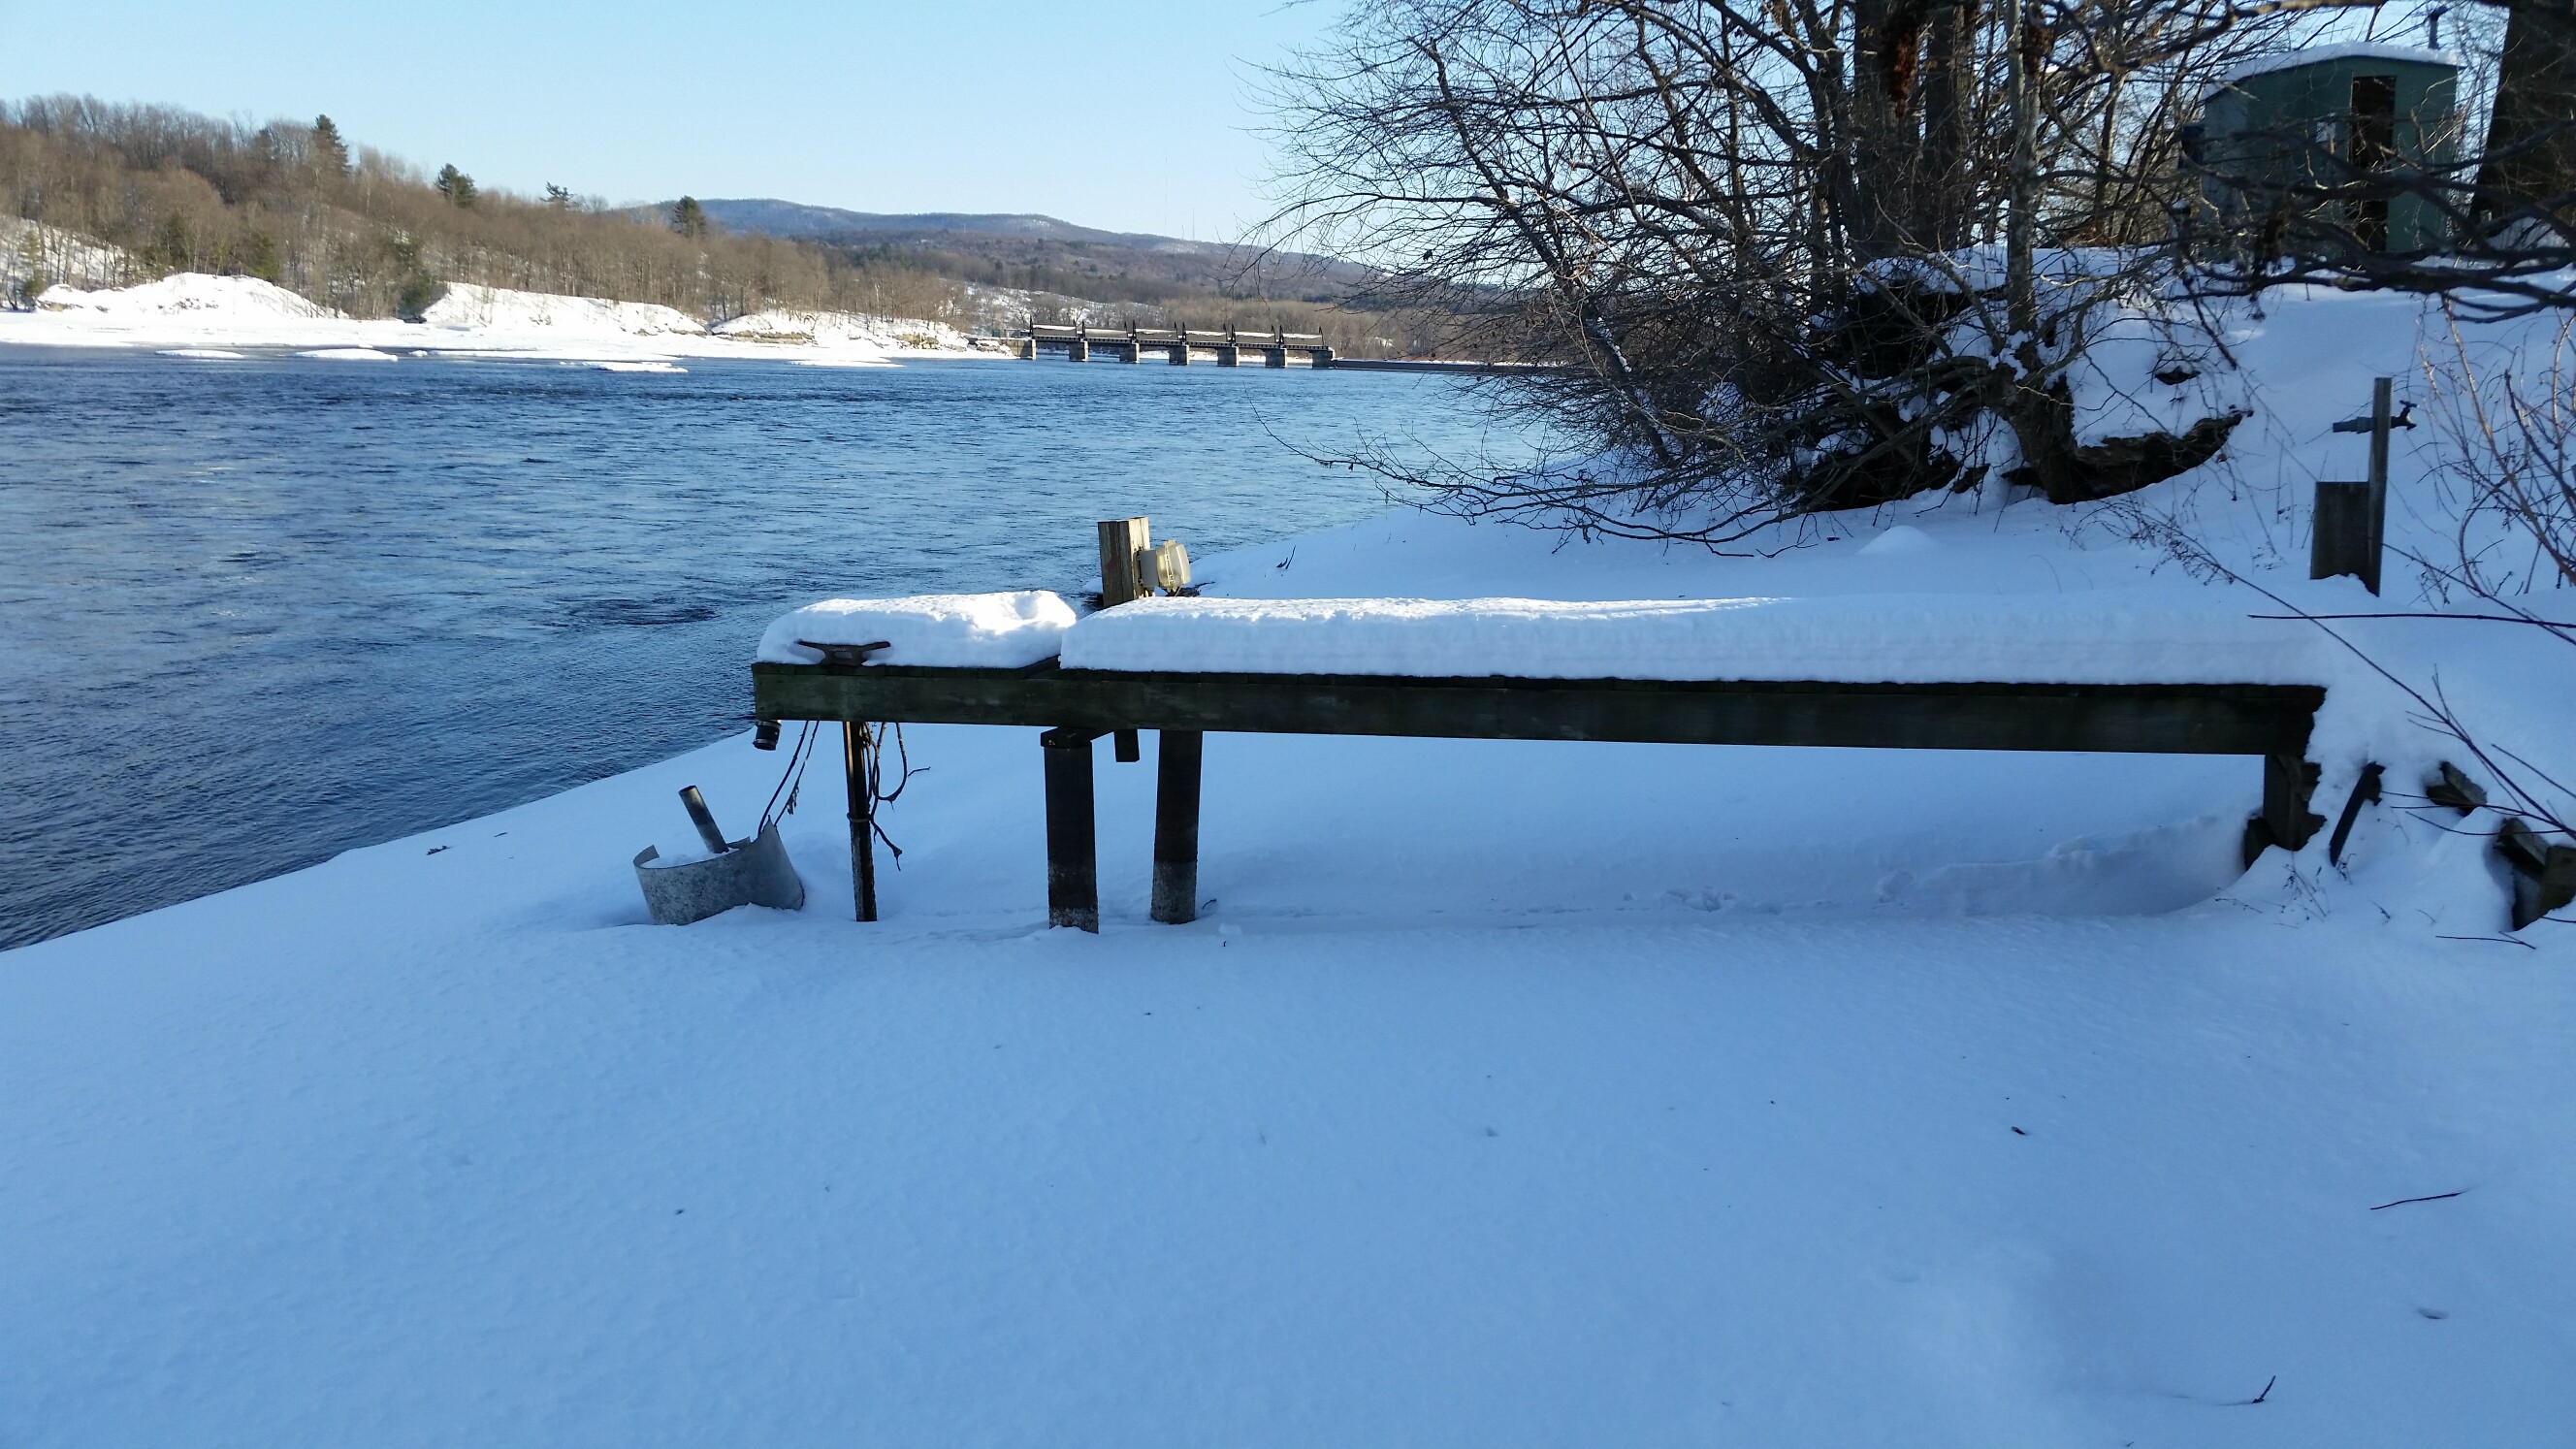 Station image
Summary of all available data for this site
Instantaneous-data availability statement

