PROVISIONAL DATA SUBJECT TO REVISION
Click to hidestation-specific text
Funding for this site is provided by:
 Site Information
LOCATION.--Lat 43°00'53", long
74°46'46" referenced to North American Datum of 1983,
Herkimer County, NY, Hydrologic Unit 02020004, on left bank
1,800 ft downstream from Fivemile Dam, 2.0 mi upstream from
East Canada Creek, and 4.5 mi southeast of city of Little
Falls.
DRAINAGE AREA.--1,342 mi².
PERIOD OF RECORD.--October 1927 to current year.
REVISIONS HISTORY.--WSP 741: 1929(M). WSP 1302: 1932(M). WSP 1432: 1928-30. WDR NY-85-1: Drainage area. Datum of gage was revised on Sept. 25, 2024, from 308.50 ft to 308.18 ft above NAVD of 1988, based on an updated geodetic survey.
GAGE.--Water-stage recorder and crest-stage gage. Datum of gage is 308.84 ft above NGVD of 1929 (levels by Corps of Engineers) and 308.18 ft above NAVD of 1988.
REMARKS.--Prior to October 1998, records of daily discharge include diversion at Fivemile Dam into Erie (Barge) Canal for lockages at Lock 16, near St. Johnsville. During canal navigation season, water is received from Black River basin through Black River Canal flowing south. Water is diverted into (or may occasionally be received from) Oswego River basin through summit level of Erie (Barge) Canal between New London and Utica. Diurnal fluctuation caused by powerplants and locks and dams on Erie (Barge) Canal. Regulation by Delta (station 01335900) and Hinckley (station 01343900) Reservoirs.
Water Years 2014-24: Records fair.
EXTREMES FOR PERIOD OF RECORD.--Maximum discharge, 36,900 ft³/s, Nov. 2, 2019, gage height, 19.86 ft; minimum discharge (river channel only), 214 ft³/s, Aug. 18, 1949, gage height, 3.75 ft.
EXTREMES OUTSIDE PERIOD OF RECORD.--Maximum discharge (since at least 1898) prior to regulation by Hinckley Reservoir, 34,800 ft³/s, Mar. 27, 1913 (from report by R. E. Horton, 1913), at site 01346500 "at Little Falls" (drainage area, 1,290 mi²).
 WaterAlert – get an
email or text (SMS) alert based on your chosen threshold.
WaterAlert – get an
email or text (SMS) alert based on your chosen threshold.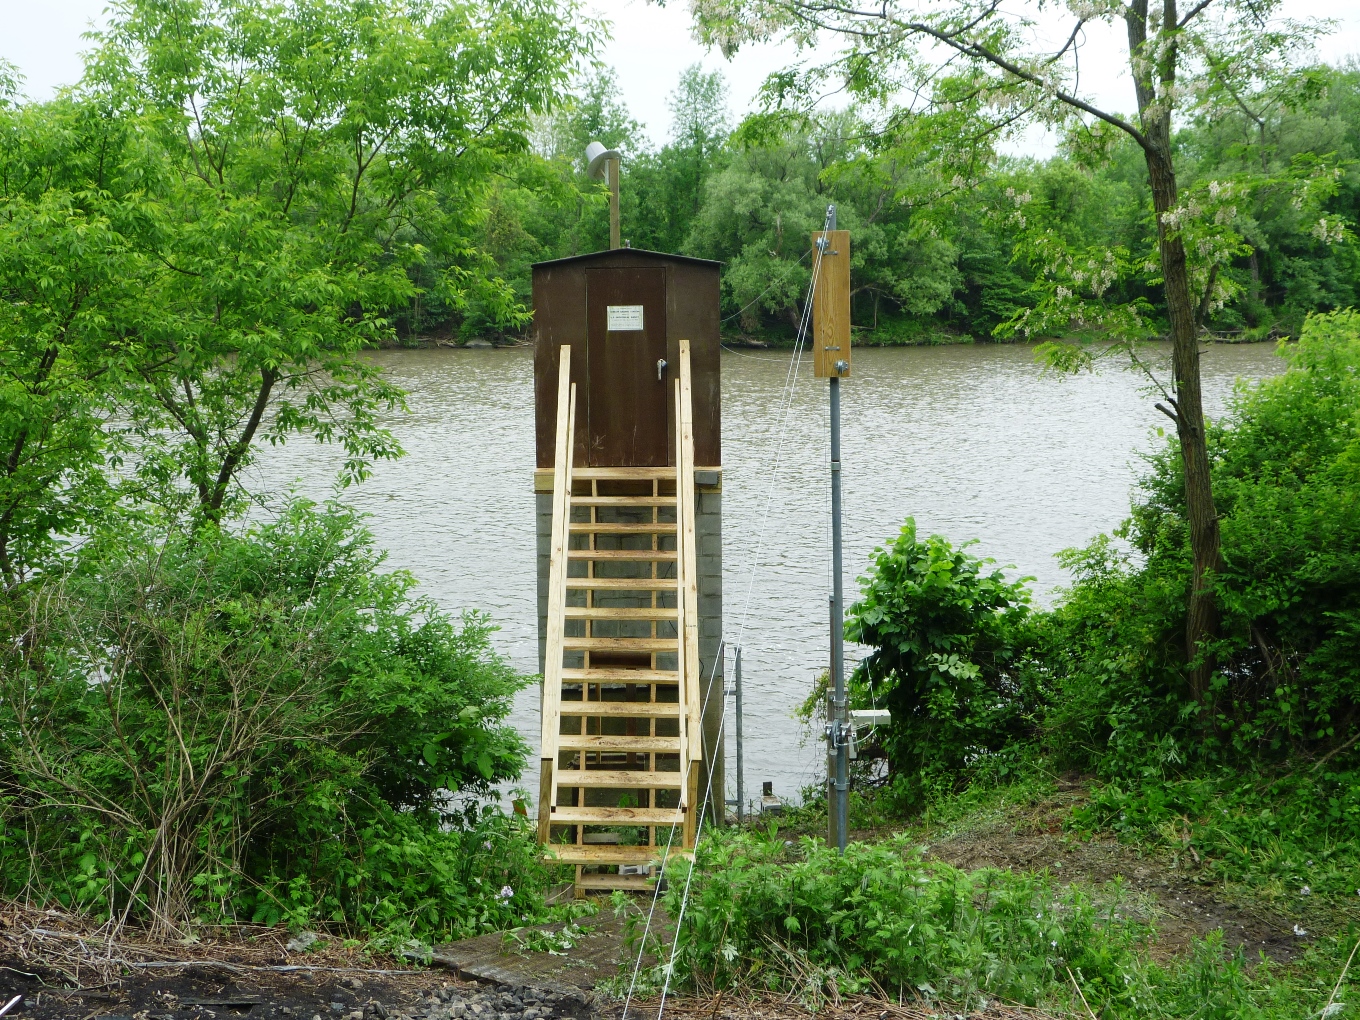 Station image
Summary of all available data for this site
Instantaneous-data availability statement

