PROVISIONAL DATA SUBJECT TO REVISION
 Site Information
-
LOCATION.--Lat 41°22'14.1", long 74°41'49.7" referenced to North American Datum of 1983, Pike County, PA, Hydrologic Unit 02040104, on right bank 250 ft downstream from bridge on U.S. Highways 6 and 209 between Port Jervis, NY and Matamoras, PA, 1.2 mi upstream from Neversink River, and 6.5 mi downstream from Mongaup River.
DRAINAGE AREA.--3,076 mi².
PERIOD OF RECORD.--October 1904 to current year.
REVISIONS HISTORY.--WSP 1031: 1905-36. WDR NY-71-1: 1970. WDR NY-82-1: Drainage area. WDR NY-86-1: 1979-80. WDR NY-04-1: 2003.
GAGE.--Water-stage recorder and crest-stage gage. Datum of gage is 415.35 ft above NGVD of 1929 and 414.78 ft above NAVD of 1988. Prior to Aug. 14, 1928, nonrecording gage at bridge 250 ft upstream at same datum; operated by U.S. Weather Service prior to June 20, 1914.
REMARKS.--Flow regulated by Prompton Reservoir (station 01428900), General Edgar Jadwin Reservoir (station 01429400), Lake Wallenpaupack (station 01431700), Toronto Reservoir (station 01433100), Cliff Lake (station 01433200), Swinging Bridge Reservoir (station 01433000), and smaller reservoirs. Large diurnal fluctuations at medium and low flows caused by powerplants on tributary streams. Subsequent to September 1954, entire flow from 371 mi² of drainage area controlled by Pepacton Reservoir (station 01416900), and subsequent to October 1963, entire flow from 454 mi² of drainage area controlled by Cannonsville Reservoir (station 01424997). Part of flow from these reservoirs diverted for New York City municipal supply. Remainder of flow (except for conservation releases and spill) impounded for release during periods of low flow in the lower Delaware River basin, as directed by the Delaware River Master.
Water Years 2014-24: Records good except those for estimated daily discharges, which are poor.
EXTREMES FOR PERIOD OF RECORD.--Maximum discharge prior to current degree of regulation, 233,000 ft³/s, Aug. 19, 1955, gage height, 23.91 ft, from floodmarks in gage house, outside gage height was 24.16 ft, from floodmark, from rating curve extended above 130,000 ft³/s, on basis of slope-area measurement of peak flow; maximum discharge since current degree of regulation, 189,000 ft³/s, June 28, 2006, gage height, 21.47 ft, outside gage height was 22.16 ft, from crest-stage gage; maximum gage height, 26.6 ft, Feb. 12, 1981 (ice jam), from floodmarks; minimum observed discharge, 175 ft³/s, Sept. 23, 1908, gage height, 0.6 ft.
EXTREMES OUTSIDE PERIOD OF RECORD.--The U.S. Weather Bureau reported a discharge of 205,000 ft³/s, Oct. 10, 1903, gage height, 23.1 ft, from rating curve extended above 70,000 ft³/s, by velocity-area studies; maximum gage height, 25.5 ft, Mar. 8, 1904 (ice jam).
PERIOD OF DAILY RECORD1.--
SPECIFIC CONDUCTANCE: January to September 1973, June 2019 to October 2024.
WATER TEMPERATURE: February 1957 to September 1960, January to September 1973, June 1974 to January 1994, October 1998 to August 2001, June 2019 to current year.
SUSPENDED-SEDIMENT DISCHARGE: February 1957 to September 1960, March 1970 to June 1976.
REMARKS1.--Temperature readings prior to Oct. 1, 2007, rounded to the nearest 0.5 °C.
EXTREMES FOR PERIOD OF DAILY RECORD1.--
WATER TEMPERATURE: Prior to Oct. 1, 2007--Maximum (water years 1957-59, 1973-81, 1983-84, 1988-93, 1999-2000), 30.5°C, July 5, 1999; minimum (water years 1958-60, 1973, 1975-93, 1999), 0.0°C on many days during winter periods, except 1984. WATER TEMPERATURE: After Oct. 1, 2007--Maximum, 29.0 °C, June 30, 2021; minimum, -0.1 °C on many days during winter period in 2020-22 water years.
SPECIFIC CONDUCTANCE: Maximum, 126 uS/cm at 25 °C, Mar. 17, 2023; minimum, 27 uS/cm at 25 °C, June 30, July 1, 1973.
SUSPENDED-SEDIMENT CONCENTRATION (water years 1957-60, 1970-76): Maximum daily mean, 760 mg/L, June 29, 1973; minimum daily mean, less than 1 mg/L on many days.
SUSPENDED-SEDIMENT DISCHARGE (water years 1957-60, 1970-76): Maximum daily, 187,000 tons, June 29, 1973; minimum daily, 1 ton, Aug. 29, 1957.
1 Water-Quality Records
 WaterAlert – get an email or text (SMS) alert based on your chosen threshold.
Additional Site Information
WaterAlert – get an email or text (SMS) alert based on your chosen threshold.
Additional Site Information
Click on time-lapse image to see the latest full size video. Click on the Static Image to view the latest image For mobile devices, click this link.
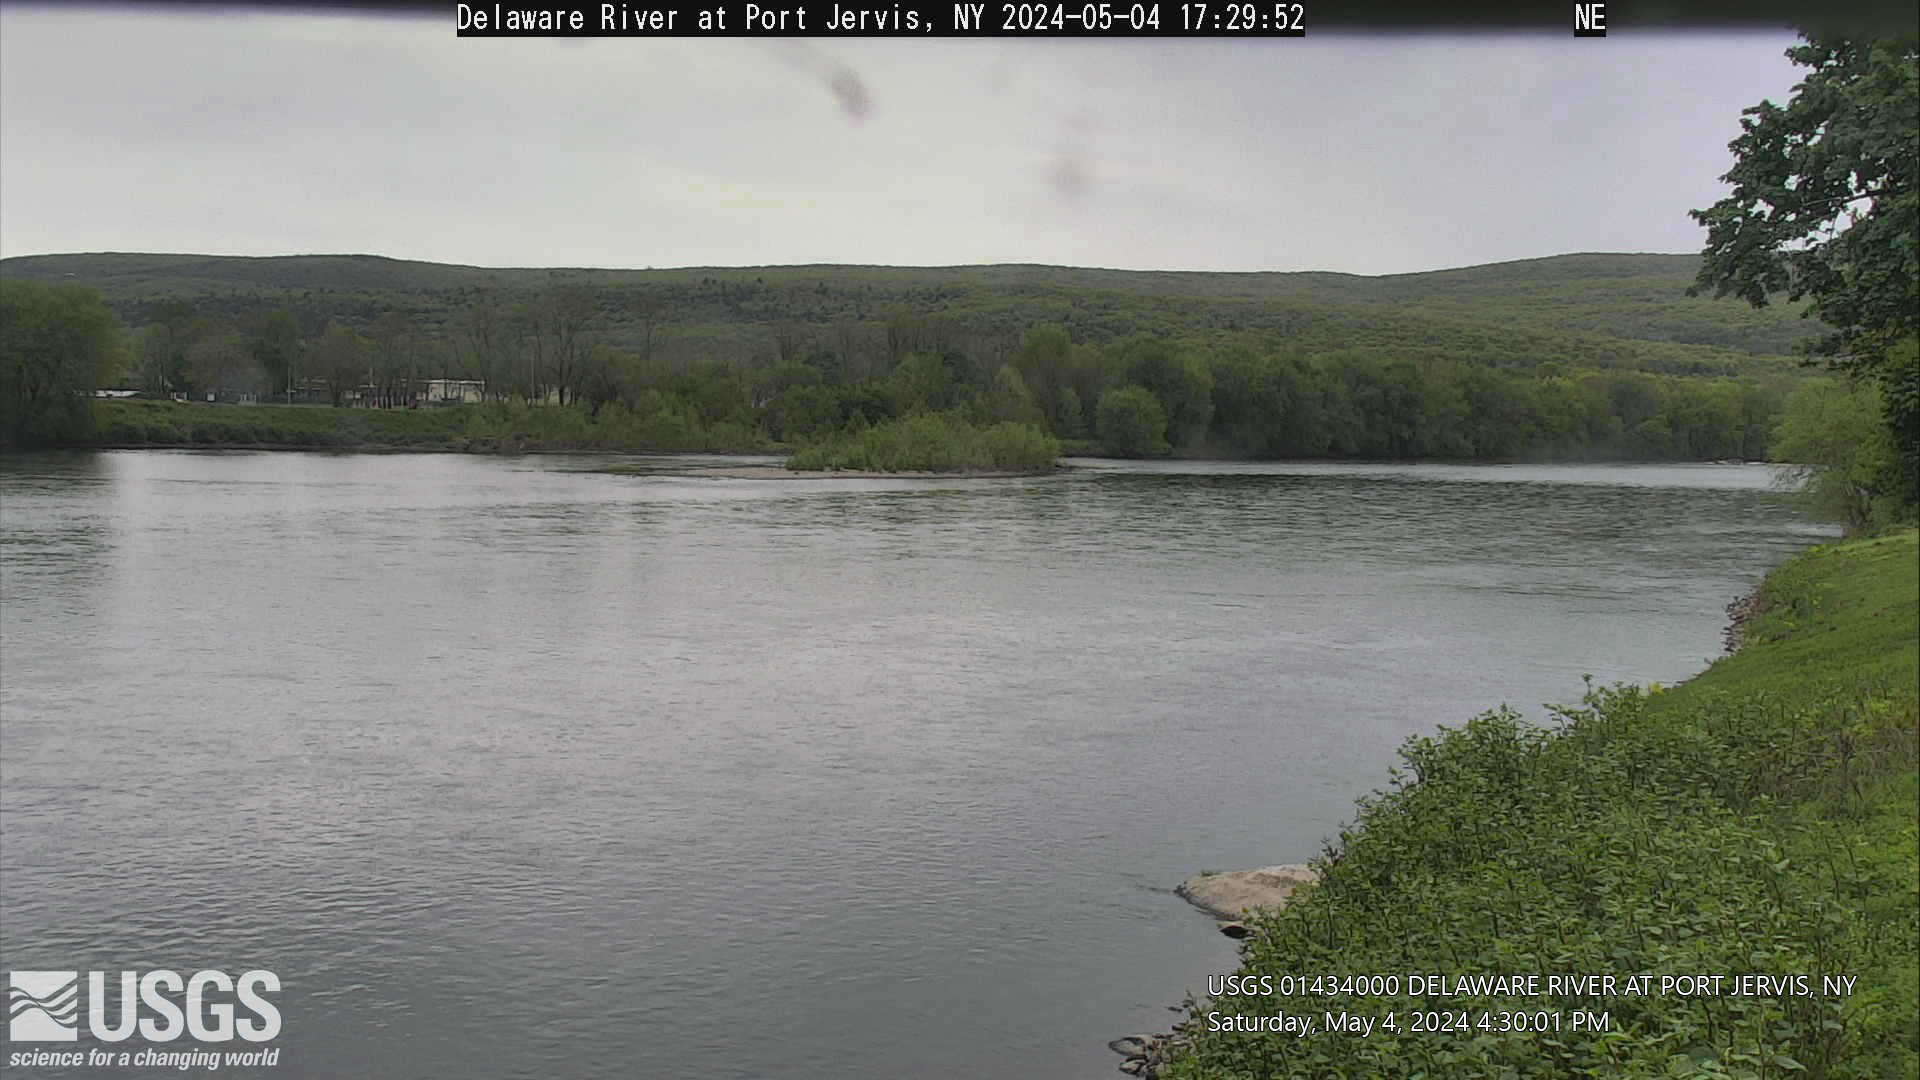 |
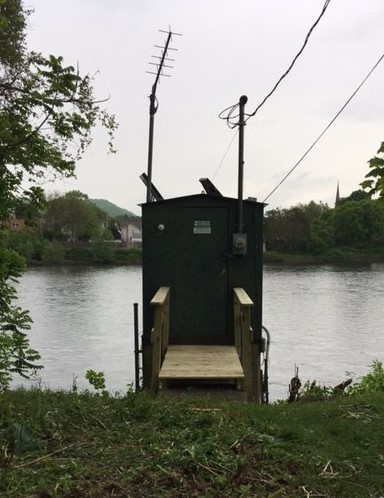 Station image
Summary of all available data for this site
Instantaneous-data availability statement


