PROVISIONAL DATA SUBJECT TO REVISION
Click to hidestation-specific text
Funding for this site is provided by:
 Site Information
LOCATION.--Lat 42°13'05.0", long
75°50'53.3" referenced to North American Datum of
1983, Broome County, NY, Hydrologic Unit 02050102, on left bank
in Chenango Valley State Park, and 1.2 mi downstream from
Tioughnioga River and Village of Chenango Forks.
DRAINAGE AREA.--1,483 mi².
PERIOD OF RECORD.--November 1912 to current year.
GAGE.--Water-stage recorder. Datum of gage is 871.63 ft above NGVD of 1929 and 871.18 ft above NAVD of 1988. Nov. 11, 1912 to Oct. 1, 1914, nonrecording gage, and Oct. 2, 1914 to Aug. 2, 1936, water-stage recorder, at site 300 ft upstream at same datum.
REMARKS.--Since March 1942, flood flows partly regulated by Whitney Point Lake (station 01511000). Slight diversion from upstream tributaries into Mohawk River basin for operation of Erie (Barge) Canal.
Water Years 2014-15: Records good except those for estimated daily discharges, which are fair.
Water Years 2016-24: Records good except those for estimated daily discharges, which are poor.
EXTREMES FOR PERIOD OF RECORD.--Maximum discharge, since construction of Whitney Point Lake in 1942, 49,500 ft³/s, Sept. 8, 2011, gage height, 14.93 ft; maximum gage height, 14.99 ft, Feb. 4, 1992 (ice jam); minimum discharge, 79 ft³/s, Sept. 3, 4, 5, 6, 1999.
EXTREMES FOR PERIOD PRIOR TO REGULATION.--Maximum discharge, prior to construction of Whitney Point Lake in 1942, 96,000 ft³/s, July 8, 1935, gage height, 20.3 ft, from floodmarks, from rating curve extended above 41,000 ft³/s on basis of slope-area measurement of peak flow; minimum discharge, 84 ft³/s, Sept. 19, 25, 1939.
 WaterAlert – get an
email or text (SMS) alert based on your chosen threshold.
WaterAlert – get an
email or text (SMS) alert based on your chosen threshold.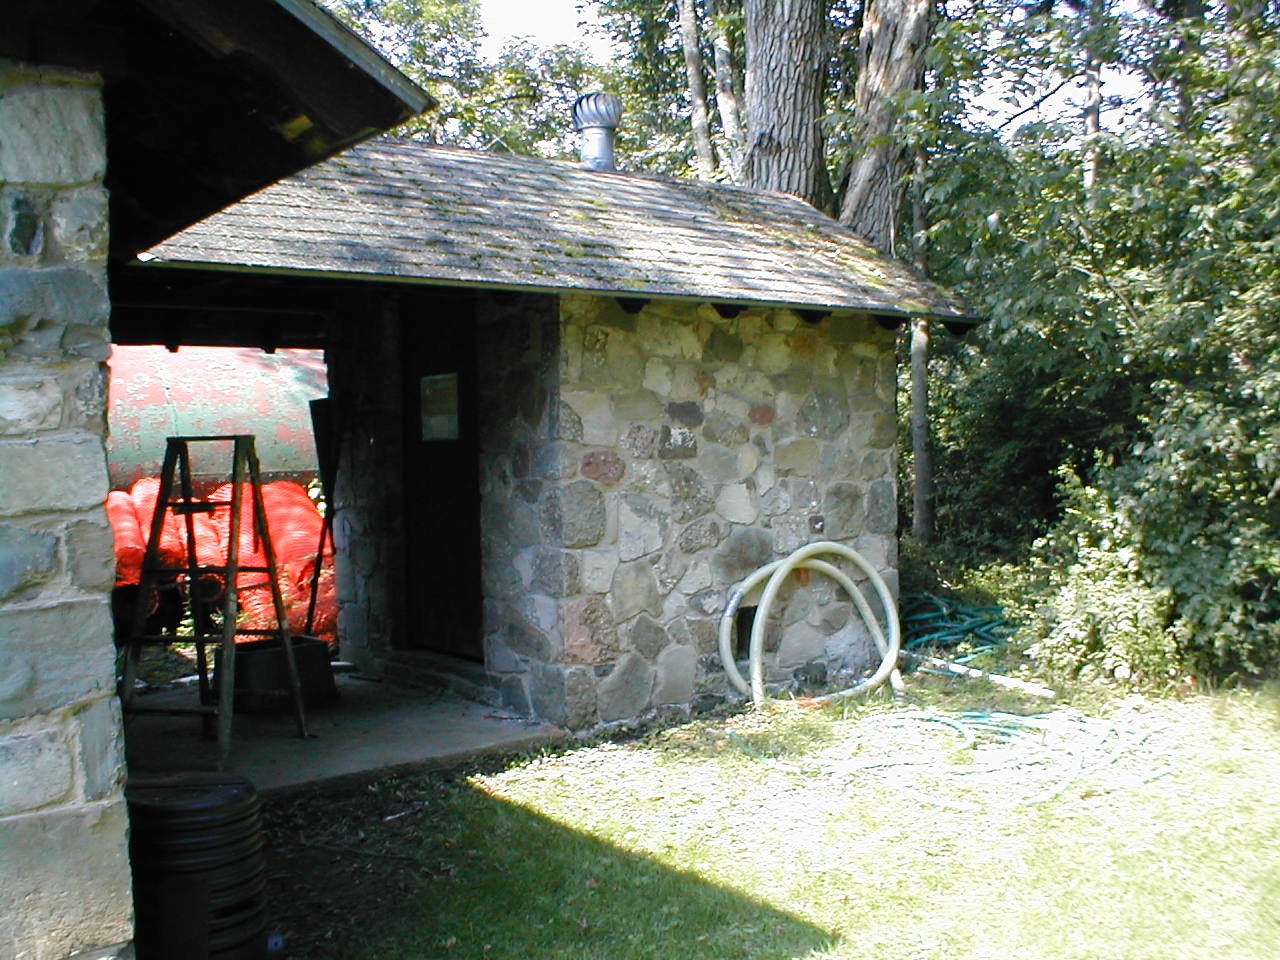 Station image
Summary of all available data for this site
Instantaneous-data availability statement

