Warning: Javascript must be enabled to use all the features on this page!

Warning: Javascript must be enabled to use all the features on this page!

Warning: Javascript must be enabled to use all the features on this page!

Warning: Javascript must be enabled to use all the features on this page!

  USGS Water Resources    


News - updated May 22,2013 RSS icon
Warning! May 23, 2013 10:45 EDT: Update: The outage of the GOES-13 East satellite that occurred on May 22, 2013 which has kept some USGS Water Data current condition data from being updated is only affecting a few sites presently.

Page Loading - Please Wait...

USGS 03539600 DADDYS CREEK NEAR HEBBERTSBURG, TN


PROVISIONAL DATA SUBJECT TO REVISION


This site is operated in cooperation with the:

National Park Service
nps logo

and

Tennessee Wildlife Resources Agency
TWRA logo

The USGS operates the stage and discharge gage and the National Park Service operates the water-quality gage. The USGS does not provide any quality assurance for water-quality data.
For more information on the water-quality data, please contact: James Hughes, NPS Hydrologist, 4564 Leatherwood Ford Road Oneida, TN 37841 phone: 423-569-2404 ext. 248 fax: 423-569-2717 email: james_d_hughes@nps.gov
Boating safety tips
This station managed by the Knoxville Field Office.


Available Parameters Available Period
All 7 Available Parameters for this site
  
00060 Discharge 2007-10-01  2013-05-24
00065 Gage height 2007-10-01  2013-05-24
00010 Temperature, water 2012-10-19  2013-05-24
00095 Specific cond at 25C 2012-10-19  2013-05-24
00400 pH 2012-10-19  2013-05-24
63680 Turbidity, Form Neph 2012-10-19  2013-05-24
00300 Dissolved oxygen 2012-10-19  2013-05-24

Graph
Graph w/ stats
Graph w/o stats
Graph w/ (up to 3) parmsNew
Table
Tab-separated
Days  (7)
 

  -- or --
Begin date
 

End date


Summary of all available data for this site
  Instantaneous-data availability statement
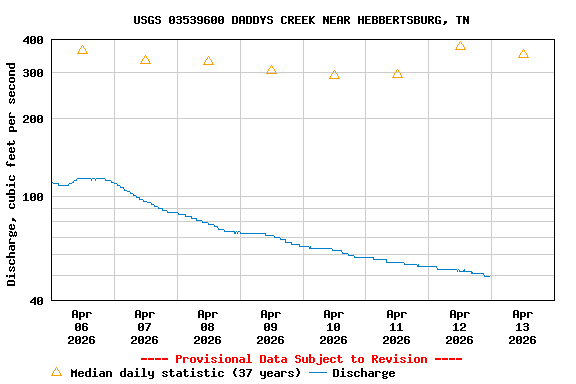
Discharge, cubic feet per second
Most recent instantaneous value: 568   05-24-2013  03:15 CDT
Graph of  Discharge, cubic feet per second    
Create presentation-quality / stand-alone graph.   Subscribe to WaterAlert Introduction page WaterAlert      


Daily discharge, cubic feet per second -- statistics for May 24 based on 25 years of record more
Min
(1962)
25th
percen-
tile
Median Mean 75th
percen-
tile
Most Recent
Instantaneous
Value May 24
Max
(1957)
8.0 45 62 120. 166 568 690

Gage height, feet
Most recent instantaneous value: 3.60   05-24-2013  03:15 CDT
Graph of  Gage height, feet    
Create presentation-quality / stand-alone graph.   Subscribe to WaterAlert Introduction page WaterAlert      


Temperature, water, degrees Celsius
Most recent instantaneous value: 16.9   05-24-2013  03:00 CDT
Graph of  Temperature, water, degrees Celsius    
Create presentation-quality / stand-alone graph.   Subscribe to WaterAlert Introduction page WaterAlert      


Specific conductance, water, unfiltered, microsiemens per centimeter at 25 degrees Celsius
Most recent instantaneous value: 65   05-24-2013  03:00 CDT
Graph of  Specific conductance, water, unfiltered, microsiemens per centimeter at 25 degrees Celsius    
Create presentation-quality / stand-alone graph.   Subscribe to WaterAlert Introduction page WaterAlert      


pH, water, unfiltered, field, standard units
Most recent instantaneous value: 7.4   05-24-2013  03:00 CDT
Graph of  pH, water, unfiltered, field, standard units    
Create presentation-quality / stand-alone graph.   Subscribe to WaterAlert Introduction page WaterAlert      


Turbidity, water, unfiltered, monochrome near infra-red LED light, 780-900 nm, detection angle 90 +-2.5 degrees, formazin nephelometric units (FNU)
Most recent instantaneous value: 4.0   05-24-2013  03:00 CDT
Graph of  Turbidity, water, unfiltered, monochrome near infra-red LED light, 780-900 nm, detection angle 90 +-2.5 degrees, formazin nephelometric units (FNU)    
Create presentation-quality / stand-alone graph.   Subscribe to WaterAlert Introduction page WaterAlert      


Dissolved oxygen, water, unfiltered, milligrams per liter
Most recent instantaneous value: 8.9   05-24-2013  03:00 CDT
Graph of  Dissolved oxygen, water, unfiltered, milligrams per liter    
Create presentation-quality / stand-alone graph.   Subscribe to WaterAlert Introduction page WaterAlert      


Questions about sites/data? Data Tips
Feedback on this web site Explanation of terms
Automated retrievals Subscribe for system changes
Help News

Accessibility Plug-Ins FOIA Privacy Policies and Notices

Take Pride in America logo USA.gov logo U.S. Department of the Interior | U.S. Geological Survey
Title: USGS Current Conditions for the Nation
URL: http://waterdata.usgs.gov/nwis/uv?

Page Contact Information: Tennessee Water Data Support Team
Page Last Modified: 2013-05-24 04:56:45 EDT
1.38   1.14 vaww02