USGS Water Resources    


News - updated January 2010

USGS 04087120 MENOMONEE RIVER AT WAUWATOSA, WI


PROVISIONAL DATA SUBJECT TO REVISION


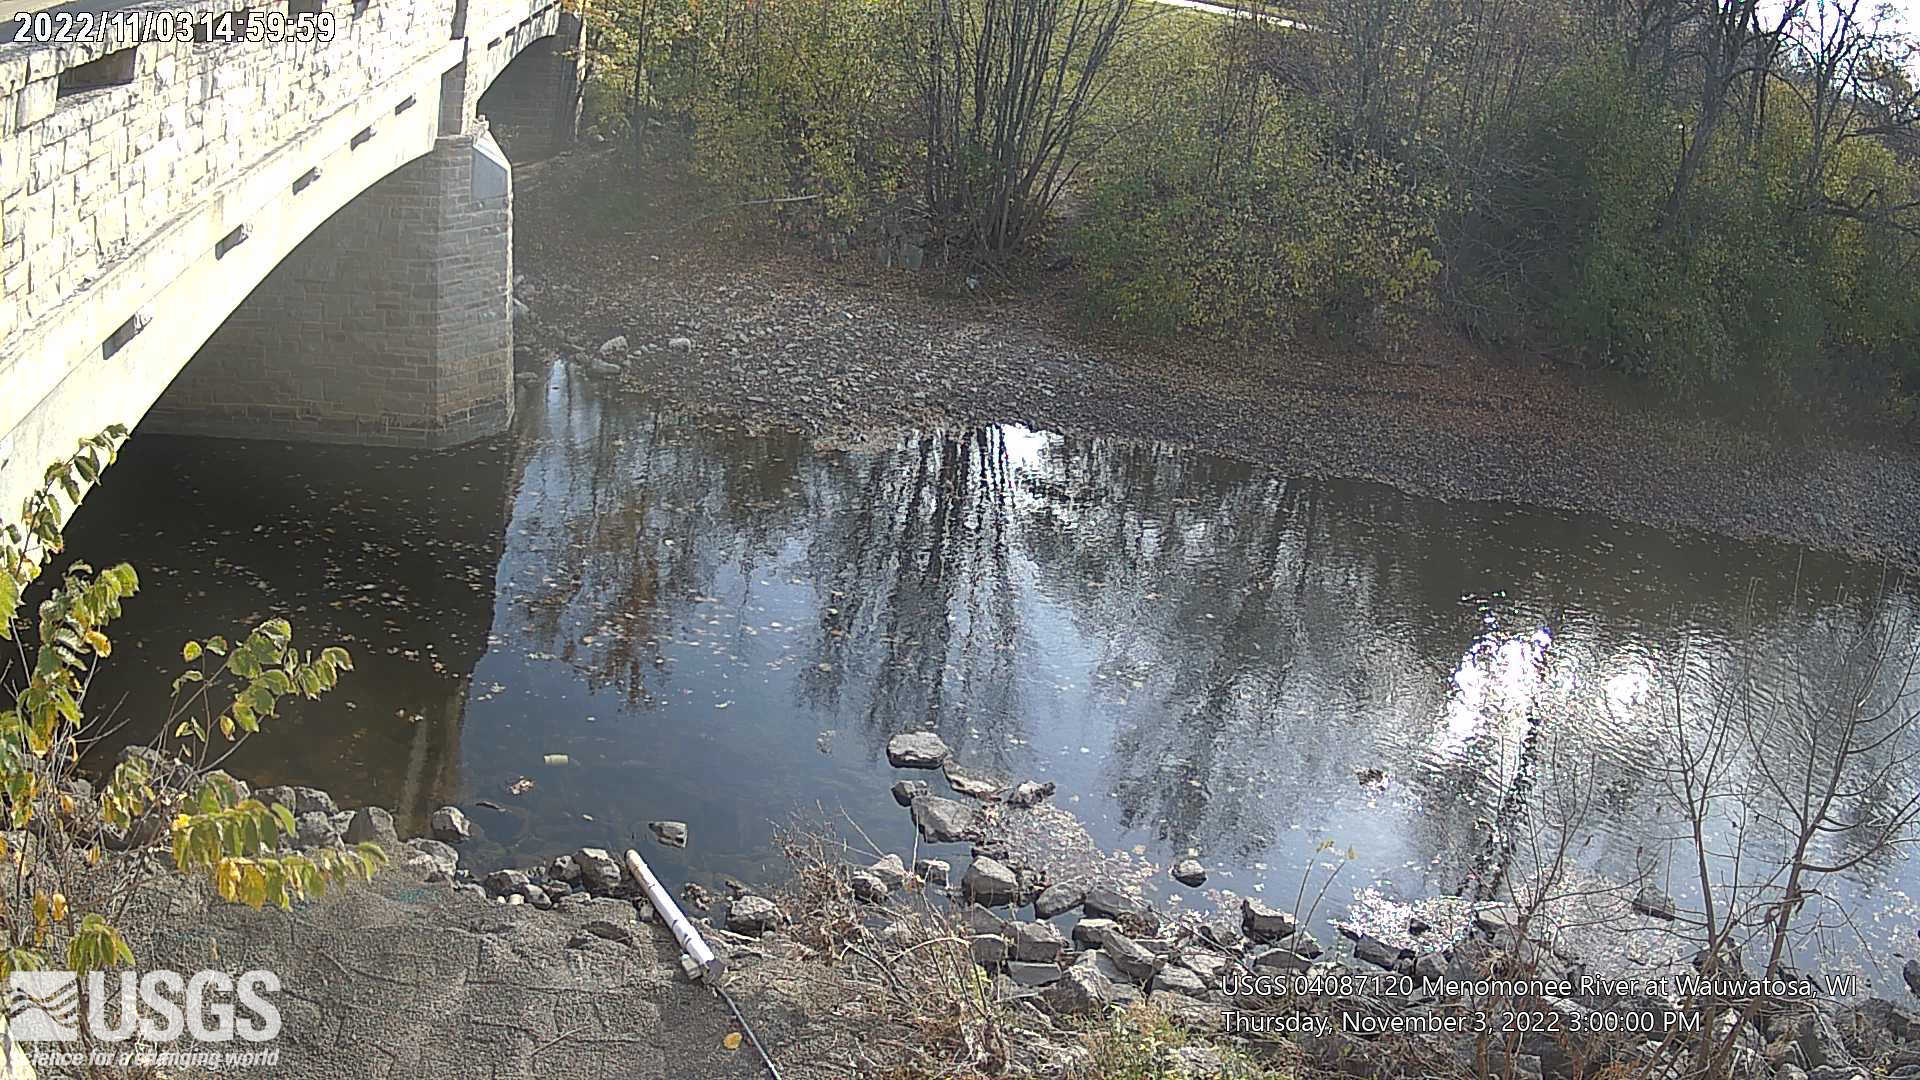
LOCATION.--Lat 43°02'44", long 87°59'59", in NE 1/4 NW 1/4 sec.27, T.7 N., R.21 E., Milwaukee County, Hydrologic Unit 04040003, on left bank near upstream side of 70th Street bridge in Wauwatosa, 800 ft downstream from Honey Creek, and at mile 6.2.

DRAINAGE AREA.--123 square miles.

PERIOD OF RECORD.--October 1961 to present.

GAGE.--Water-stage recorder and crest-stage gage. Datum of gage is 628.58 ft above sea level NAVD88. Prior to Nov. 1, 1974, nonrecording gage at present site and datum then in use. Prior to June 21, 1997 at 0320, datum was 2.00 ft higher.

REMARKS.--Gage-height telemeter at station.

OPERATED IN COOPERATION WITH:

Milwaukee Metropolitan Sewerage District Logo Milwaukee Metropolitan Sewerage District

Southeastern Wisconsin Regional Planning Commission Logo SEWRPC

Additional Information:

National Weather Service Logo National Weather Service Flood Forecast Page

The precipitation data for this station are temporary and will only be displayed for 60 days. Although the instrumentation is calibrated at least annually, the temporary classification means that documented routine inspections and other quality-assurance measures are not performed that would make the data acceptable for archival, retrieval, or future use in general scientific or interpretive studies.


Available Parameters
All 7 Available Parameters for this site
00045 Precipitation
00060 Discharge
00065 Gage height
00010 Temperature, water (YSI)
00095 Specific cond at 25C (YSI)
63680 Turbidity, Form Neph (YSI)
00300 Dissolved oxygen (YSI)

Graph
Graph w/ stats
Graph w/o stats
Table
Tab-separated
Days

 (1-120)
 

Summary of all available data for this site

Precipitation, total, inches
 
-- Data temporarily unavailable for the time period specified --

Discharge, cubic feet per second
Most recent instantaneous value: Ice   02-10-2010  00:15 CST
Graph of  Discharge, cubic feet per second    
Create presentation-quality / stand-alone graph parm 00060 DD02
Daily discharge statistics, in cfs, for Feb 10 based on 47 years of record more
Min
(1963)
20th
percen-
tile
Median 80th
percen-
tile
Mean Most Recent
Instantaneous
Value
Max
(1966)
4.5 21 36 101 119 Ice 1890

Gage height, feet
Most recent instantaneous value: 2.96   02-10-2010  00:15 CST
Graph of  Gage height, feet    
Create presentation-quality / stand-alone graph parm 00065 DD05

Temperature, YSI, water, degrees Celsius
Most recent instantaneous value: 1.7   02-10-2010  00:00 CST
Graph of  Temperature, YSI,  water, degrees Celsius    
Create presentation-quality / stand-alone graph parm 00010 DD14

Specific conductance, YSI, water, unfiltered, microsiemens per centimeter at 25 degrees Celsius
Most recent instantaneous value: 2,390   02-10-2010  00:00 CST
Graph of  Specific conductance, YSI,  water, unfiltered, microsiemens per centimeter at 25 degrees Celsius    
Create presentation-quality / stand-alone graph parm 00095 DD15

Turbidity, water, unfiltered, monochrome near infra-red LED light, 780-900 nm, detection angle 90 +/ -2.5 degrees, formazin nephelometric units YSI (FNU)
Most recent instantaneous value: 7.7   02-10-2010  00:00 CST
Graph of  Turbidity, water, unfiltered, monochrome near infra-red LED light, 780-900 nm, detection angle 90 +/ -2.5 degrees, formazin nephelometric units YSI (FNU)    
Create presentation-quality / stand-alone graph parm 63680 DD16

Dissolved oxygen, YSI, water, unfiltered, milligrams per liter
Most recent instantaneous value: 13.1   02-10-2010  00:00 CST
Graph of  Dissolved oxygen, YSI,  water, unfiltered, milligrams per liter    
Create presentation-quality / stand-alone graph parm 00300 DD18

Questions about sites/data? Top
Feedback on this web site Explanation of terms
Automated retrievals Subscribe for system changes
Help News

Accessibility FOIA Privacy Policies and Notices

Take Pride in America logo USA.gov logo U.S. Department of the Interior | U.S. Geological Survey
Title: USGS Real-Time Water Data for the Nation
URL: http://waterdata.usgs.gov/nwis/uv?

Page Contact Information: Wisconsin Water-Data Support Team
Page Last Modified: 2010-02-10 03:44:55 EST
3.29   3.43 ca02