PROVISIONAL DATA SUBJECT TO REVISION
Click to hidestation-specific text
Funding for this site is provided by:
 Site Information
LOCATION.--Lat 42°34'13", long
78°02'32" referenced to North American Datum of 1983,
Wyoming County, NY, Hydrologic Unit 04130002, on left bank at
Portageville, 500 ft downstream from bridge on State Highway
436, 800 ft upstream from abandoned railroad bridge piers, 0.9
mi upstream from Upper Falls, and 89.8 mi upstream from
mouth.
DRAINAGE AREA.--984 mi².
PERIOD OF RECORD.--August 1908 to current year. Prior to December 1945, published as "at St. Helena". Records published for both sites December 1945 to September 1950.
REVISIONS HISTORY.--WSP 264: 1908. WSP 564: 1916 (M). WDR NY-82-3: Drainage area. WDR NY-72-1: 1950 (M), 1951 (M), 1956 (M), 1959 (M), 1964 (M), 1967 (M).
GAGE.--Water-stage recorder. Datum of gage is 1,080.00 ft above NGVD of 1929 (levels by Corps of Engineers) and 1,079.72 ft above NAVD of 1988. Prior to Aug. 24, 1911, nonrecording gage, and Aug. 24, 1911 to Sept. 30, 1946, water-stage recorder, at site 8 mi downstream at different datum. Oct. 1, 1946 to June 21, 1972, water-stage recorder at site 1,200 ft downstream at datum 2.60 ft higher (destroyed by flood of June 1972). June 21, 1972 to July 11, 1972, nonrecording gage at same site and datum. July 12, 1972 to May 18, 1973, nonrecording gage at site 500 ft upstream at datum 11.48 ft higher.
REMARKS.--Since July 1928, some seasonal regulation by Rushford Lake. Between early 1920s and 2000, possible diurnal fluctuation at low flow caused by powerplant on Wiscoy Creek. Monthly figures of discharge and runoff, 1952 to 1966 water years, adjusted for change in contents in Rushford Lake.
Water Years 2014-24: Records good except those for estimated daily discharges, which are poor.
EXTREMES FOR PERIOD OF RECORD.--Maximum discharge, about 90,000 ft³/s, June 23, 1972, gage height, 35.25 ft, at site 1,200 ft downstream at datum 2.60 ft higher, from floodmark, from rating curve extended above 25,000 ft³/s on basis of contracted-opening measurement of 71,000 ft³/s, 0.4 mi upstream, and contracted-opening measurement of 98,200 ft³/s, 0.7 mi downstream from gage; minimum discharge, 18 ft³/s, Oct. 5, 17, 1913, gage height, 1.70 ft, site and datum then in use.
PERIOD OF DAILY RECORD1.--SUSPENDED-SEDIMENT DISCHARGE: April 1975 to September 1977.
EXTREMES FOR PERIOD OF DAILY RECORD1.--SUSPENDED-SEDIMENT CONCENTRATION: Maximum daily mean, 5,160 mg/L, May 7, 1975; minimum daily mean, 1 mg/L, July 2, 1975. SUSPENDED-SEDIMENT DISCHARGE: Maximum daily, 222,000 tons, Feb. 17, 1976; minimum daily, 0.96 ton, July 2, 1975.
1 Water-Quality Records
 WaterAlert – get an
email or text (SMS) alert based on your chosen threshold.
WaterAlert – get an
email or text (SMS) alert based on your chosen threshold.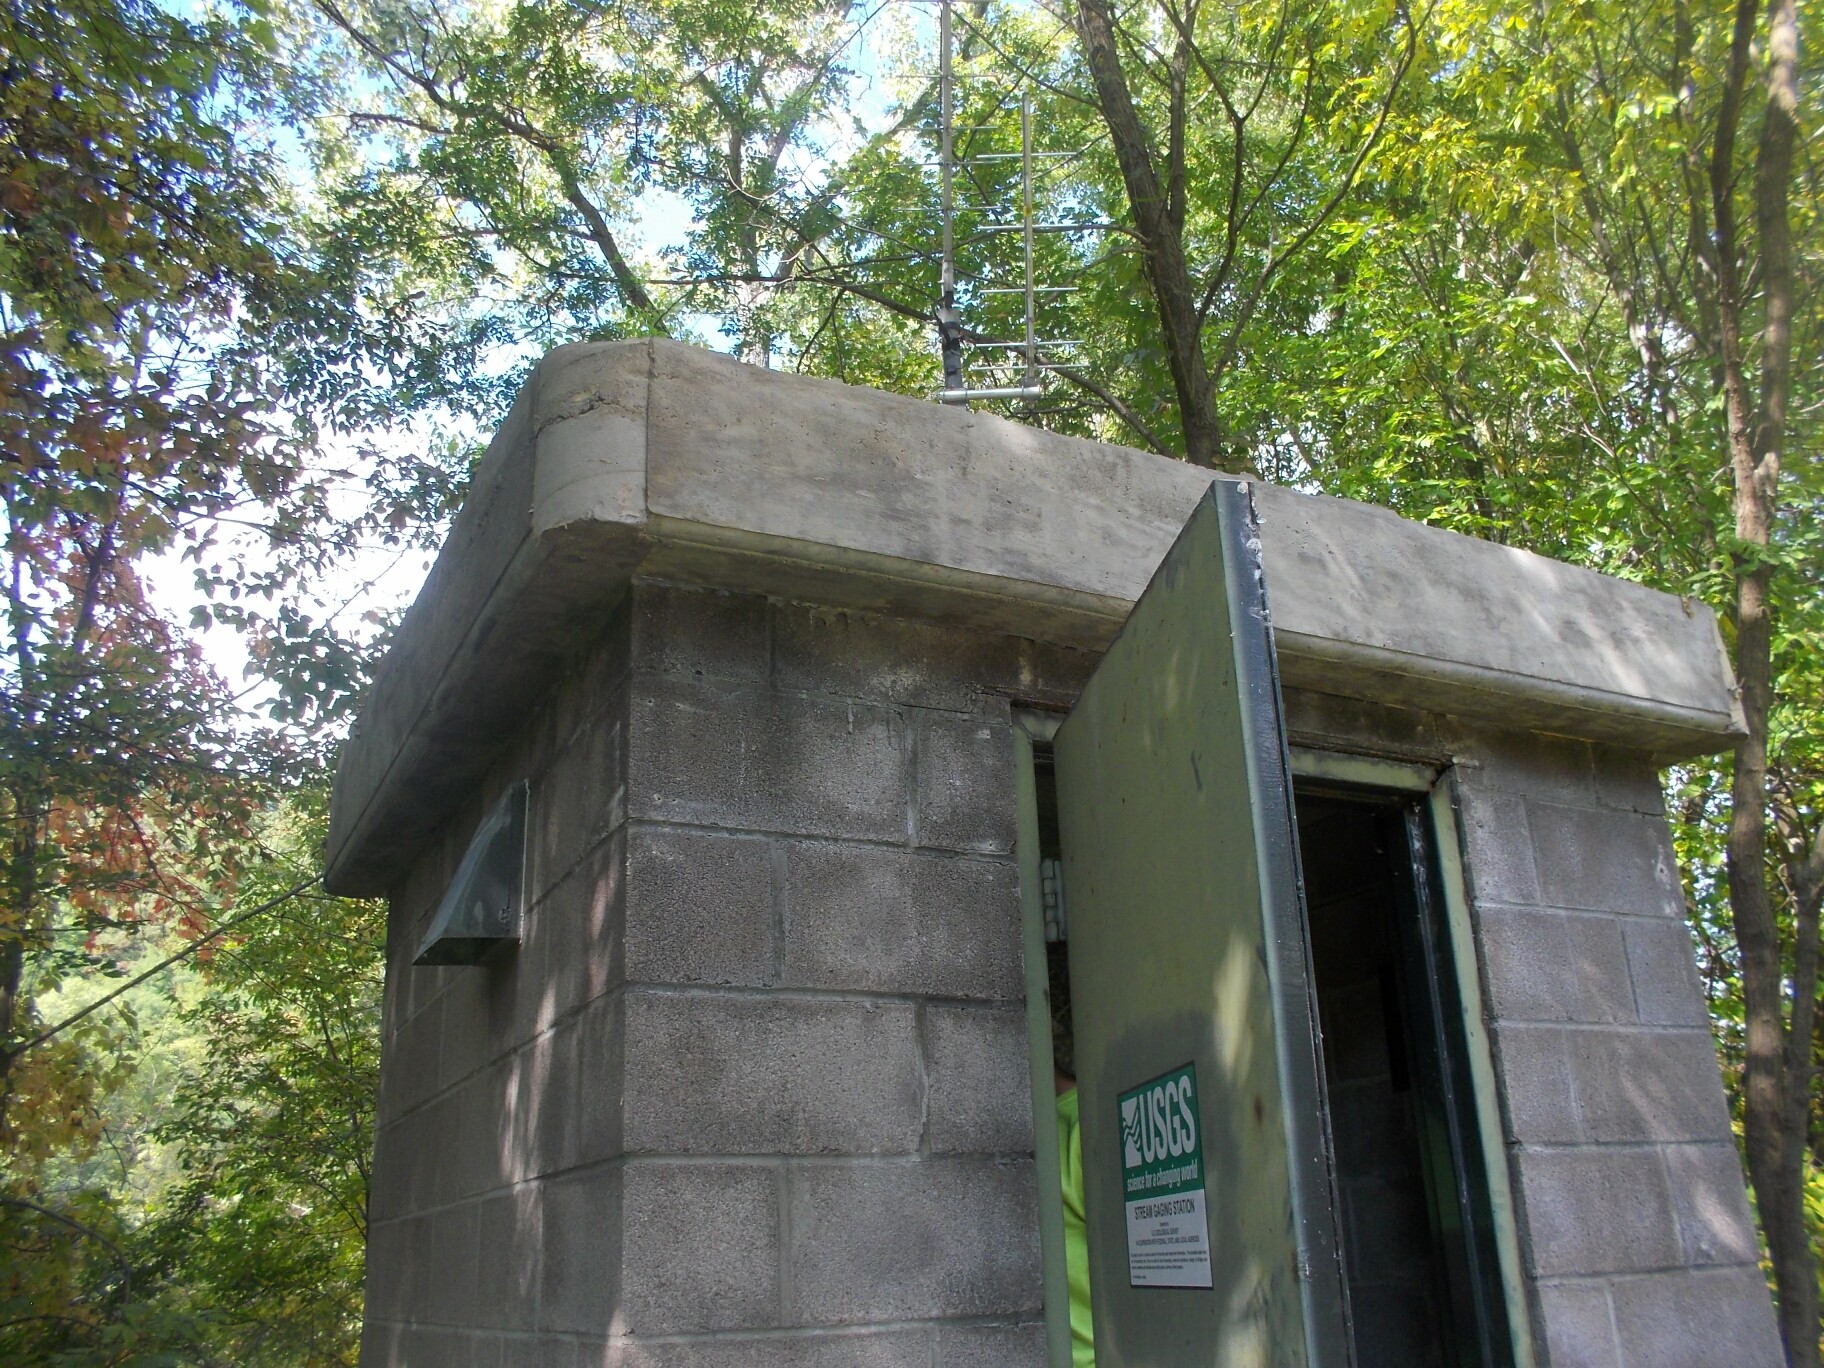 Station image
Summary of all available data for this site
Instantaneous-data availability statement

