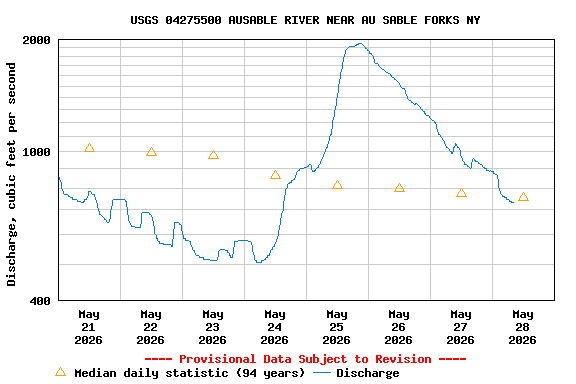
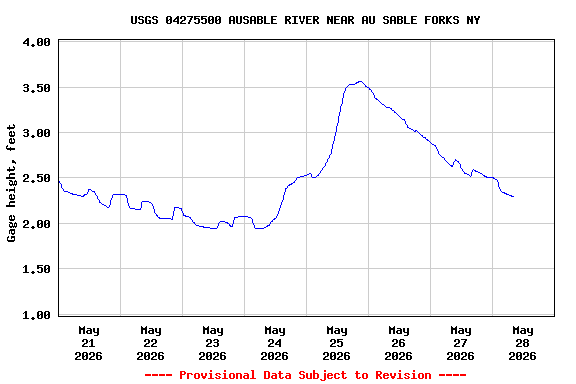
PROVISIONAL DATA SUBJECT TO REVISION
Click to hidestation-specific text
Funding for this site is provided by:
 Site Information
LOCATION.--Lat 44°27'06.3", long
73°38'33.6" referenced to North American Datum of
1983, Clinton County, NY, Hydrologic Unit 04150404, on left
bank 1.8 mi downstream from confluence of East and West
Branches, and 1.8 mi east of Au Sable Forks.
DRAINAGE AREA.--446 mi².
PERIOD OF RECORD.--August 1910 to September 1968, March 1990 to current year. Prior to October 1924, published as "at Au Sable Forks". Monthly discharge only for winter periods during 1911 and 1913 water years, published in WSP 1307.
REVISIONS HISTORY.--WSP 1307: 1911-19 (M), 1922-24 (M). Gage height and discharge for the period Aug. 1, 2022 to Aug. 8, 2023 were revised on Feb. 15, 2024, based on new gage height correction applied.
GAGE.--Water-stage recorder and crest-stage gage. Datum of gage is 505.65 ft above NGVD of 1929 and 505.37 ft above NAVD of 1988. Prior to Oct. l, 1924, nonrecording gage at site 1.5 mi upstream at different datum.
REMARKS.--Minor storage in several lakes in the headwaters of the basin. During the 1920s to 1950s, flows could have been affected by operation of a hydroelectric plant (Nye Dam) near Upper Jay. Storage in Taylor Pond in the Black Brook basin; formerly regulation due to hydroelectric plant at site (dates unknown). Regulation from pulp and paper mill operations at Rome Dam, 3.2 mi upstream on the West Branch, from 1893 to 1971.
Water Years 2014-24: Records good except those for estimated daily discharges, which are poor.
EXTREMES FOR PERIOD OF RECORD.--Maximum discharge, 46,500 ft³/s, Aug. 28, 2011, gage height, 15.54 ft, from rating curve extended above 16,000 ft³/s on basis of runoff comparison of peak flows from contracted-opening measurements at gage heights 13.83 ft and 15.54 ft at site 3.9 mi downstream; minimum discharge, practically no flow July 21, 1912, result of unusual regulation.
EXTREMES OUTSIDE PERIOD OF RECORD.--Flood of Feb. 23, 1990 (ice jam), reached a stage of 14.5 ft, from floodmark 200 ft upstream from gage.
 WaterAlert – get an
email or text (SMS) alert based on your chosen threshold.
WaterAlert – get an
email or text (SMS) alert based on your chosen threshold.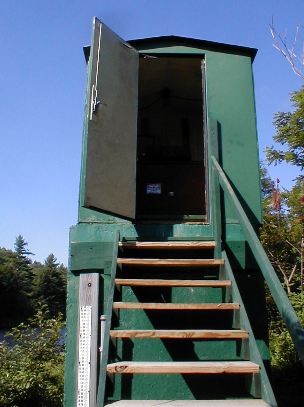 Station image
Summary of all available data for this site
Instantaneous-data availability statement