USGS Water Resources    


News - updated January 2010

USGS 13068500 BLACKFOOT RIVER NR BLACKFOOT ID


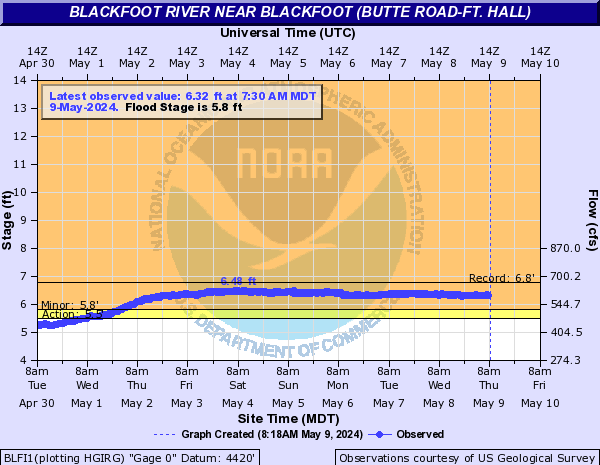
PROVISIONAL DATA SUBJECT TO REVISION

 
  Blackfoot River near Blackfoot, ID - USGS file photo
LOCATION.--Lat 43° 07'50", long 112° 28'36", (NAD83), near E 1/2 corner, 
   sec.28, T.3 S., R.34 E., Bingham County, Hydrologic Unit 17040207, Moreland quad., 
   Fort Hall Indian Reservation, on left bank 11 ft upstream from highway bridge, 
   8 mi southwest of Blackfoot, and at mile 3.4.

DRAINAGE AREA.--1,295 mi2, including that of Sand Creek, flow of which is 
   diverted to Blackfoot River through the Idaho Canal.

PERIOD OF RECORD.--July 1913 to current year (prior to October 1931, summer 
   months only). Monthly discharge only for some periods, published in WSP 1317.

REVISED RECORDS.--WSP 1217: Drainage area.

GAGE.--Elevation of gage is 4,420 ft above NGVD of 1929, from river-profile survey. 
   Prior to May 8, 1926, nonrecording gage, and May 8, 1926 to June 25, 1937, 
   water-stage recorder at site 0.5 mi upstream at different datum. June 26, 1937 
   to Aug. 16, 1963, water-stage recorder at site 175 ft downstream at same datum.

REMARKS.--Flow regulated by Blackfoot Reservoir. Diversions above station for 
   irrigation of about 28,000 acres below and about 32,000 acres above station, 
   of which about 900 acres are irrigated by withdrawals from ground water (1966 
   determination). Part of flow is supplied by waste water from Snake River canals. 
   Diversions to the bypass channel (sta 13068495) 5.5 mi upstream from station 
   began in April 1964. For records and statistics of combined discharges, 
   see station 13068501.

EXTREMES FOR PERIOD OF RECORD.--Maximum discharge prior to Blackfoot River Bypass 
   channel diversion, 1,710 ft3/s Feb. 11, 1962, gage height, 7.68 ft. 

   Since 1964, river only: maximum discharge, 740 ft3/s June 12, 1984, gage height, 
   5.53 ft;  maximum gage height, 6.77 ft, June 16, 1997, (backwater from the Snake 
   River);  no flow at times some years. 

Station operated in cooperation with Idaho Department of Water Resources.

(Button) Current shift-adjusted rating in tab-separated format.
These are updated daily and can change often! If you use these ratings it is important that you update often so that you have the most current version.
What is a shift-adjusted rating?


Available Parameters
All 3 Available Parameters for this site
00060 Discharge
00065 Gage height
00010 Temperature, water

Graph
Graph w/ stats
Graph w/o stats
Table
Tab-separated
Days

 (1-120)
 

Summary of all available data for this site

Discharge, cubic feet per second
Most recent instantaneous value: Ice   02-09-2010  22:30 MST
Graph of  Discharge, cubic feet per second    
Create presentation-quality / stand-alone graph parm 00060 DD01
Daily discharge statistics, in cfs, for Feb 10 based on 45 years of record more
Min
(1993)
Most Recent
Instantaneous
Value
20th
percen-
tile
Median Mean 80th
percen-
tile
Max
(1997)
23 Ice 56 82 108 157 362

Gage height, feet
Most recent instantaneous value: 2.40   02-09-2010  22:30 MST
Graph of  Gage height, feet    
Create presentation-quality / stand-alone graph parm 00065 DD02

Temperature, water, degrees Celsius
Most recent instantaneous value: 0.0   02-09-2010  22:30 MST
Graph of  Temperature, water, degrees Celsius    
Create presentation-quality / stand-alone graph parm 00010 DD14

Questions about sites/data? Top
Feedback on this web site Explanation of terms
Automated retrievals Subscribe for system changes
Help News

Accessibility FOIA Privacy Policies and Notices

Take Pride in America logo USA.gov logo U.S. Department of the Interior | U.S. Geological Survey
Title: USGS Real-Time Water Data for the Nation
URL: http://waterdata.usgs.gov/nwis/uv?

Page Contact Information: Idaho Water-Data Support Team
Page Last Modified: 2010-02-10 01:36:40 EST
1.76   1.76 ca02