USGS 09315000 GREEN RIVER AT GREEN RIVER, UT

PROVISIONAL DATA SUBJECT TO REVISION

Click to hidestation-specific text
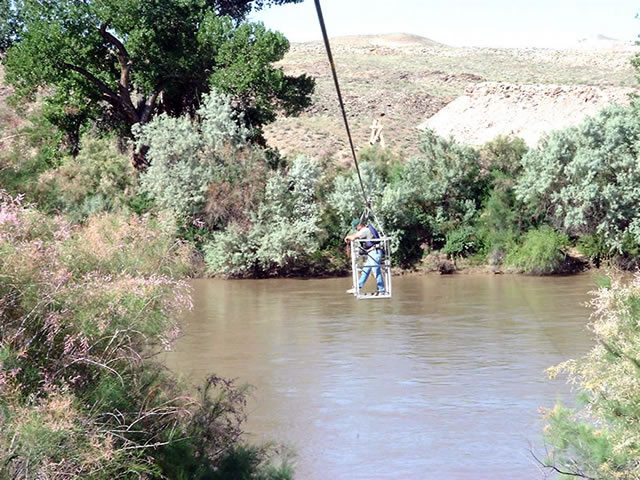
USGS station 09315000 Station operated by the U.S. Geological Survey as part of the Federal Priority Streamgages Network, in cooperation with the U.S. Bureau of Reclamation.

Logo for USGS Real-time Water Quality Visit USGS Real-Time Water Quality to view continuous estimates of concentrations and loads for bacteria and other chemicals.
This station managed by the Moab UT Field Office.

Available Parameters Available Period
  
2021-03-10  2026-05-29
2021-06-22  2026-05-29
2021-06-22  2026-05-29
2021-06-22  2026-05-29
2021-06-22  2026-05-29
2021-06-22  2026-05-29
1986-10-01  2026-05-29
2007-10-01  2026-05-29
2021-03-10  2026-05-29
2021-06-22  2026-05-29
2021-06-22  2025-11-24
2021-06-22  2025-11-24
2021-06-22  2026-05-29


 (7)
 

  -- or --


Summary of all available data for this site
Instantaneous-data availability statement


Temperature, water, degrees Celsius

Most recent instantaneous value: 19.6 05-29-2026   09:45 MDT
Graph of  Temperature, water, degrees Celsius

Add up to 2 more sites and replot for "Temperature, water, degrees Celsius"

?


Create presentation-quality / stand-alone graph.   Subscribe to WaterAlert      

See this graph on the Monitoring Location Pages


Discharge, cubic feet per second

Most recent instantaneous value: 3600 05-29-2026   09:45 MDT
Graph of  Discharge, cubic feet per second

Add up to 2 more sites and replot for "Discharge, cubic feet per second"

?


Create presentation-quality / stand-alone graph.   Subscribe to WaterAlert      

See this graph on the Monitoring Location Pages


Daily discharge, cubic feet per second -- statistics for May 29 based on 126 water years of record more
Most Recent
Instantaneous
Value May 29
Min
(1934)
25th
percen-
tile
Median Mean 75th
percen-
tile
Max
(1897)
3600 4140 11100 17400 19100 23300 63000


Gage height, feet

Most recent instantaneous value: 6.91 05-29-2026   09:45 MDT
Graph of  Gage height, feet

Add up to 2 more sites and replot for "Gage height, feet"

?


Create presentation-quality / stand-alone graph.   Subscribe to WaterAlert      

See this graph on the Monitoring Location Pages