
Doing user research to design the next-gen WDFN
A description of the user-centeric research
The USGS Water Resources Mission Area (WMA) is striving to make our water data easier to access for our users. This involves stepping back and reviewing how users currently use waterdata.usgs.gov so that we can make informed decisions moving forward.
Who is 18F?
This year USGS has partnered with 18F, a digital services group in the General Services Administration, that supports government agencies by improving web experiences through user-centric research and testing. 18F was brought in to specifically identify areas of improvement in user experience, including navigating our site and helping users find our data quickly and efficiently.
What problem is USGS trying to solve?
The USGS WMA has been providing online access to water data for 25 years and over that time the data has grown in size, scope, and complexity. Many new measurement locations have been established and new data types have been collected; striving to provide access to all of these data has made the USGS’s websites increasingly complicated.
As a part of our website modernization effort, the WMA seeks to streamline the user experience when interacting with the data on waterdata.usgs.gov. A broad set of users interact with the data available on the site, and users come in with varying levels of knowledge about the page organization and the underlying data structures by which they are organized. In order to develop a new solution that better serves our community of users, we first needed to understand more about our users’ goals and patterns of use.
UX research - How the 18F approach is different
We are using user-centered research and software development methods that help us manage risk and make sure what we build will work for people’s needs.
Observe people using the system: The most powerful way to understand user behaviors is not only to have them talk about how they use the system but to have them show us how they use the system. We set up video calls with users and have them walk us through how they find what they need in the system. This gives us an opportunity to see what is or is not effective currently.
Do just enough research to begin designing: When doing user experience (UX) research, we usually start to see diminishing returns after as few as 5-10 participants. The more important things usually bubble up first, which means we can start to build and deliver the higher-value pieces while continuing to learn more.
Keep doing research: We started with interviews and observation in order to learn more about the problem space and user needs. As we begin software development, our research is taking the form of prototyping and testing, which could include things like moderated usability tests or A/B testing.
One area of focus was to gather more user data to understand both the “How?” and “Why?” of a user’s journey through our site. We focused on the following questions:
What data are users looking for?
How are users finding their desired information?
What are user’s workflows when using the sites? Are there any common flows / patterns that people take through the website?
Are users getting the data they are looking for by the end of visit?
A second area of focus was to understand more about the individual user. Historically, the USGS has considered navigation of the website through the lens of professional affiliation (i.e., water professional, researcher, general public, USGS hydrologist). During this research we sought to understand more about our users and the similarities between the groups:
Who are the general public?
How different are general versus expert use cases / workflows?
Is our data accessible and engaging? Who does it work for? Who are we not serving well?
Who did we talk to?
USGS serves a broad variety of users, but we wanted to be targeted about which users we engaged during this round of research, prioritizing those who are most important to answering our research questions and those who we know least about.
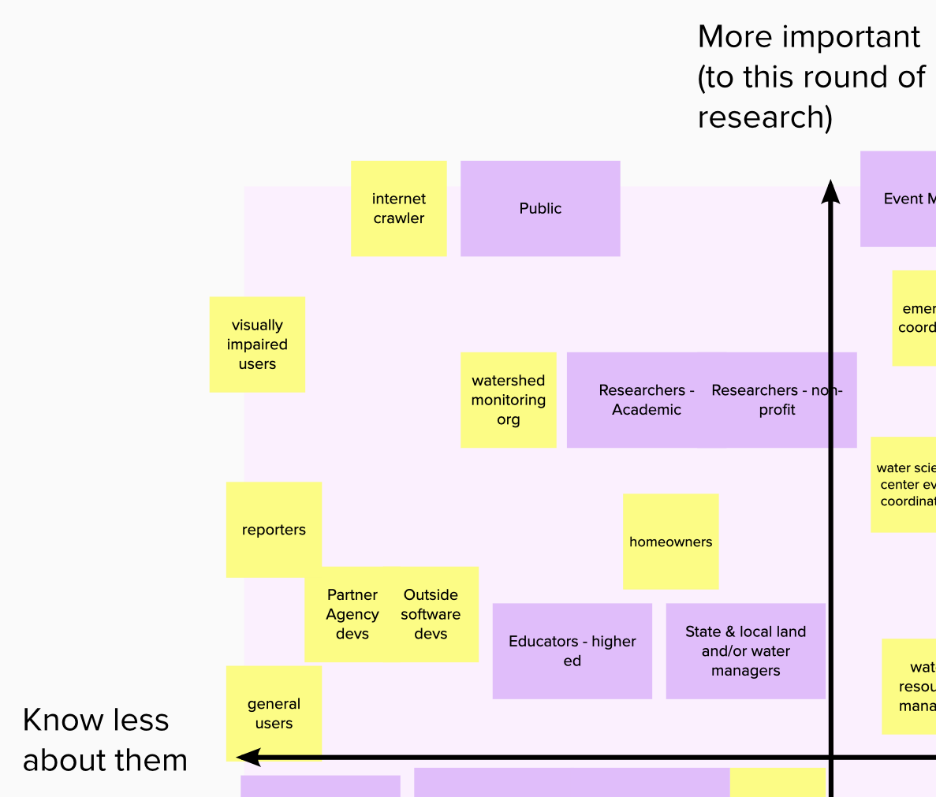
Screenshot of the result of a team brainstorming session to identify the groups we knew the least about and were the most important to this round of research
What were our assumptions?
USGS has traditionally grouped users by professional affiliation, but that didn’t necessarily correspond to how they used waterdata.usgs.gov. Our goal was to identify shared user needs and behaviors that we can design for. We referenced trends in site analytics and other background information to make informed guesses about some preliminary groups we needed to learn more about:
Users who are new to USGS water: Site analytics showed us that over 50% of people coming to the site were new users. We thought this group might include members of the public searching for water information online (such as homeowners, educators, etc.) as well as recent hires at USGS.
Users who routinely access a single data point, page, or visualization. Site analytics also showed that more than 60% of sessions were on the USGS “current conditions” pages. We thought this group of users might be homeowners living in flood prone areas who regularly check a nearby monitoring site, or outdoor enthusiasts who check certain gages before going out.
Users who query the API to get datasets. USGS has a large network of partners and collaborators who need to pull down large volumes of data. We thought this group would include researchers, data scientists, USGS staff, and large federal partners like NOAA and the US Army Corps of Engineers.
What did we learn?
After we identified these user groups, we needed to interview them to understand and observe how they use the system. Finding users to participate in research can be challenging. In this case, USGS was able to reach out to its large network of partners and collaborators to find certain types of participants, and we combed through dozens of help desk emails to find others. We also set up a recruitment form with Touchpoints to allow site visitors to opt-in to give feedback.
After doing five interviews with the three different groups, we started to see emerging patterns on users’ needs and behaviors. We noticed that our original assumptions about the preliminary groups were incorrect. Instead, we saw overlapping patterns across all the groups. This signaled the need to reevaluate the user groups. By studying and synthesizing the interview notes, we were able to regroup them into patterns of data use. We noticed three emerging types of use:
Operationalized pull: We saw this type of use among groups like federal partners and large water boards, who pulls data from multiple sources, including USGS API services, to use via custom dashboards and tools optimized for their location and needs.
Explore and Download: This group finds nearby sites and what types of data they collect. They make ad-hoc or targeted queries to download and manipulate data in their preferred tool. This type of use was common among researchers and USGS scientists.
Check Status: This group does routine checks of a few parameters for specific sites. They primarily use the hydrographs embedded on the site pages to understand the data, for example, checking conditions before going kayaking, or monitoring nearby water levels during a flood season.
After we solidified on these emerging groups, we were able to find a path forward to make using our site easier and more efficient. We looked at their journeys through the system and identified the areas we could improve to make the biggest impact for our users.
Takeaways
Research may invalidate your assumptions and that’s okay
- Original assumptions may be incorrect, go in with an open mind
Take detailed notes to help with synthesis later
- You can organize them into themes to surface patterns
See how people actually navigate your system
- It is not enough to have users talk about how they use it because they will skip over the shortcuts and navigation patterns they rely on. The only way to know is to observe while they use your system
What are the next steps?
We have recently begun the next phase of the engagement with 18F: Experiment and Iterate. For 12 weeks we will conduct user testing with prototypes of varying fidelities. The goal here is to get designs in front of users and again ask them how they would potentially complete a given task with the interface. After each interview we will tweak the design based on what we have learned. Each iteration will get us closer to the goal of a page that is easy to navigate and retrieve the data from.
Related resources
Categories:
Keywords:
Related Posts
#5NewThings
August 21, 2020
The Water Resources Mission Area is spotlighting five newly available features on our next-gen monitoring location pages this week! To compliment this blog post, we will show off our work on Instagram and Twitter, using the hashtag #5NewThings.
Water Quality Data Delivery Listening Sessions
July 28, 2020
Water Quality Data Delivery Listening Sessions Starting on August 3, 2020, the WDFN Team will be conducting a month of activities aimed at gathering input from both internal and external users to help guide development activities related to water-quality data delivery.
Decommissioning of the National Water Census - Data Portal
July 22, 2020
What are you decommissioning? As the USGS Water Mission Area (WMA) undertakes modernizing data delivery as part of implementation of the U.S. Geological Survey Water Science Strategy (Circular 1382-G), resources will be directed away from legacy applications to new development and delivery mechanisms.
Release Notes for July 21st, 2020
July 21, 2020
What have we been up to? Pubs Warehouse moved to the Cloud Behind the scenes work New features and tools Pubs Warehouse on the Cloud The Water Data for the Nation team is the primary development team for another high profile application, the USGS Publications Warehouse.
Release Notes for late March 2020
April 10, 2020
What have we been up to? Image server work Period parameter Axis scaling Networks page New features and tools Image export from monitoring location pages One of the most requested features we receive from users is the ability to export images from the monitoring location pages.