
25 years of Water Data on the Web
A look back at the beginnings of presenting water data on the web, and a peak at what the USGS is going to be doing in the next 25 years.
A few weeks ago, on February 14, 2020, the USGS celebrated the 25th anniversary of a historical milestone, the first public delivery of near real-time water information to over the internet. Prior to February 14, 1995, for 100 years virtually all USGS water data was delivered through paper reports or direct requests to USGS offices, was available primarily as daily statistics (e.g. daily mean discharge), and only after extensive data validation and review – usually a year or more after the date of collection. The transition to our current system of robust delivery of almost all instantaneous data in near real-time and on-line access to our entire historical data holdings did not happen overnight. The initial system, then called rt_www, started with only a handful of sites in Montana delivering a few days of recent streamflow data. It took years of IT development and policy and workflow changes to get to where we are today. It is questionable whether the small group of Montana Water Science Center developers of that initial system knew the full power of what they unleashed, but it is now hard to imagine water science and water resources management in the United States without what we now refer to as Water Data for the Nation
. Without invalidating any of the historical water data uses and users, it vastly expanded the range of both for the betterment of all.
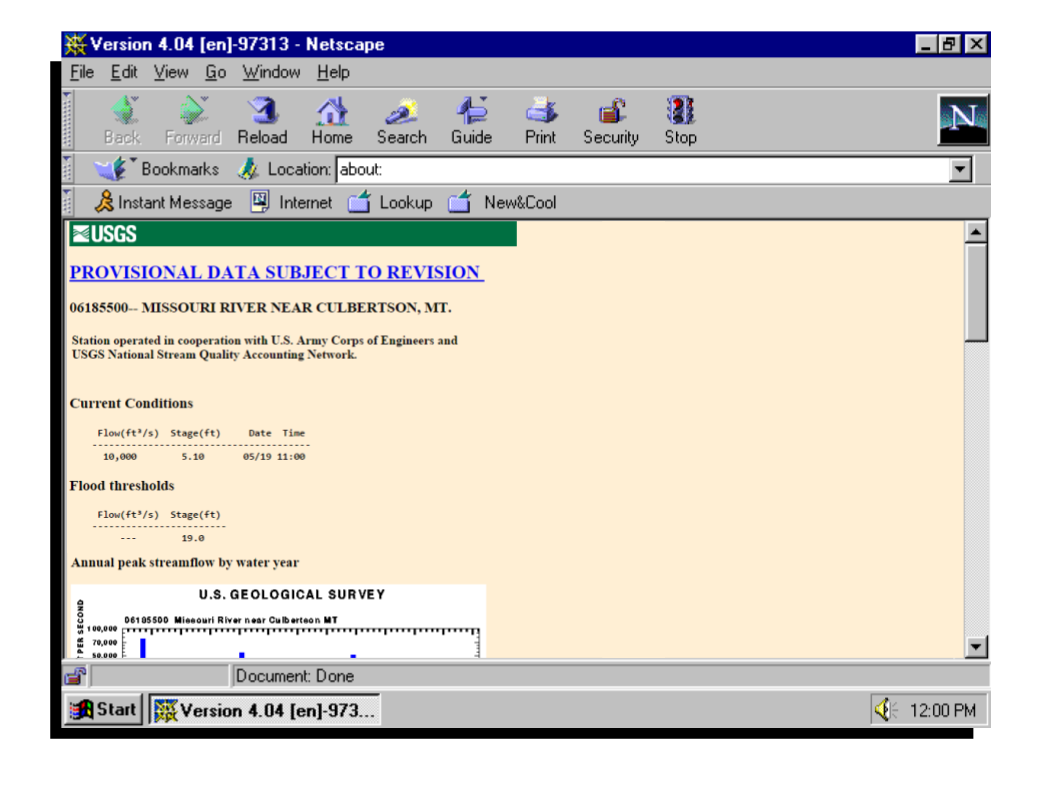
A screenshot of one of the original sites, on Water Data for the Nation, Missouri River near Culbertson MT
A few months ago, on December 18, 2019, another milestone in USGS information delivery was reached that is likely to have similar positive repercussions for both the USGS and the nation in the years ahead - the release of a new water availability mapper
. While only a concept prototype, for the first time the USGS is delivering a daily product that integrates our active monitoring with continuous modeling. Just as rt_www started the process of freeing us from data delivery latency, so the release of the new mapper has started the process of freeing us from reporting water information only where we are doing active monitoring. Rather than reporting on a few thousand sites nationally, we can now look to report on 100,000 or more. Just as the release of rt_www expanded historical users and uses without changing them, so the release of new modeled products will only further extend the range of what is possible. As with rt_www, it will take many steps over years to fully realize our plans for more types of data, more informative delivery products, and more robust data access, and there are no doubt good ideas we have not thought of yet, but we’re very excited by the first small step and look forward to the coming efforts.
The National Integrated Water Availability Assessments concept map compares current natural water storage to daily historical values. This animation shows the effects of a number of different events on natural water storage in November of 2019.
Categories:
Related Posts
Updates and improvements to the National Water Dashboard
March 19, 2026
The National Water Dashboard (NWD) continues to evolve as we modernize our water-data delivery tools and improve how users discover, explore, and interact with real‑time information. Our latest set of updates focuses on simplifying the map experience, improving usability, adding new ways to customize your view, and continuing our long‑term transition away from legacy services. Below is an overview of what’s new.
Tutorial of dataRetrieval's newest features in R
November 26, 2025
This article will describe the R-package
dataRetrieval, which simplifies the process of finding and retrieving water from the U.S. Geological Survey (USGS) and other agencies. We have recently released a new version ofdataRetrievalto work with the modernized Water Data APIs . The new version ofdataRetrievalhas several benefits for new and existing users:Daily data in Water Data for the Nation
November 21, 2025
There have been a lot of changes to how you access USGS water data as we work to modernize data delivery in WDFN and decommission NWISWeb. As we centralize and re-organize data delivery in WDFN, we have recently set out to describe different types of water data according to data collection categories . We started with re-organizing and expanding the data collection categories that are delivered on the Monitoring Location Page and are now working to deliver additional data collection categories on other WDFN pages as well. This blog is part of a series to help orient you to where you can find different types of data in WDFN pages and services. In this post, we want to focus on how you can access daily data in WDFN.
New Feature - Field Measurements
September 23, 2025
We are excited to announce a new feature on Monitoring Location pages that provide field measurements, which are physically measured values collected during a field visit to a monitoring location.
Data Graphs in Water Data for the Nation
September 16, 2025
This blog has been recently updated!
In 2025, we refreshed this blog to describe the graphing features that have come out in the WDFN ecosystem since 2023.