
Prepare for Floods with the Real-Time Flood Impact API
The USGS Real-Time Flood Impact (RT-FI) API service helps communities protect lives and property by providing flood risk context to widely-available USGS streamgage height measurements.
What's on this page
Are you prepared?
According to the National Weather Service, floods kill over 100 people in the U.S. every year on average. The USGS Real-Time Flood Impact (RT-FI) API can help you and your community to stay prepared.
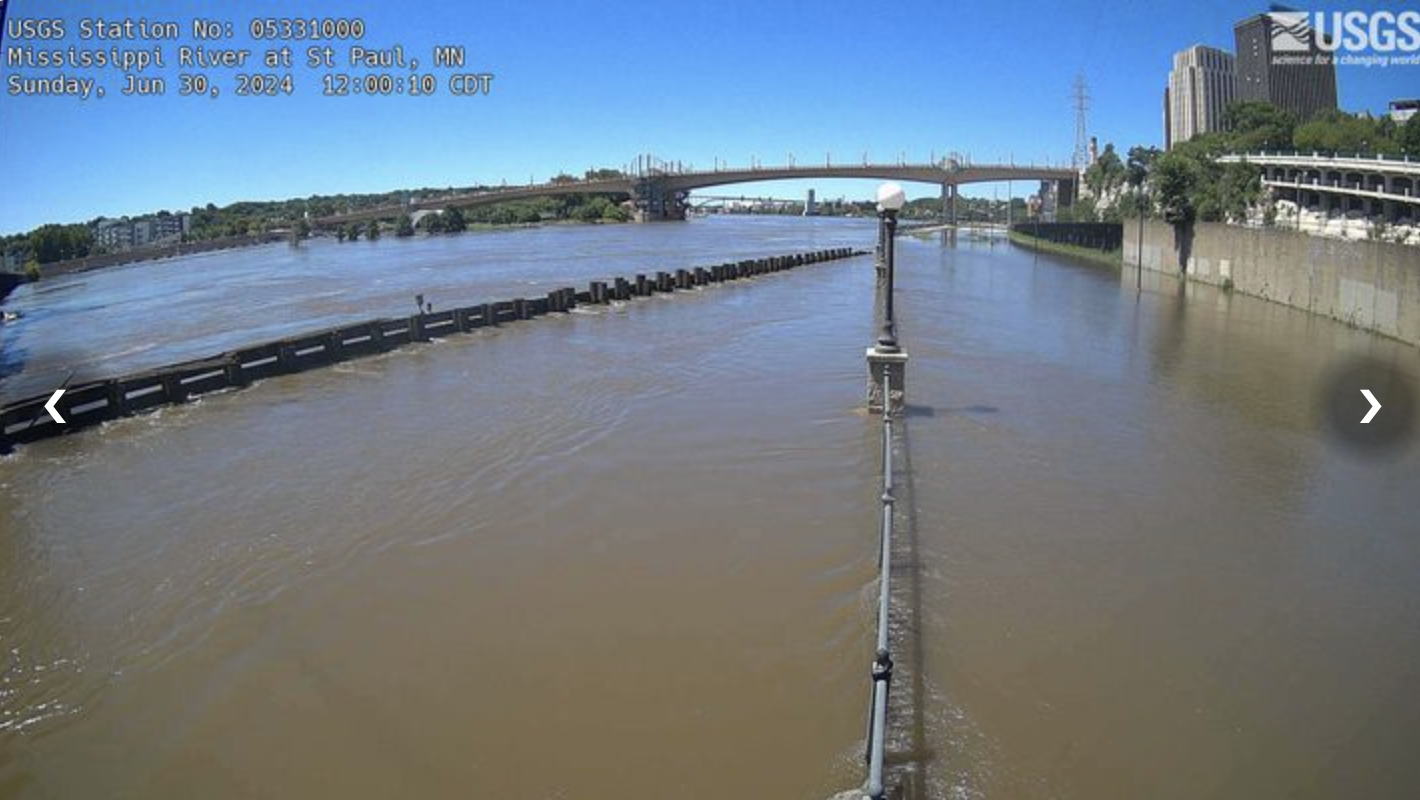
Roadway and walkway flooding at a Flood Impact Location in downtown St. Paul, Minnesota on June 30 2024.
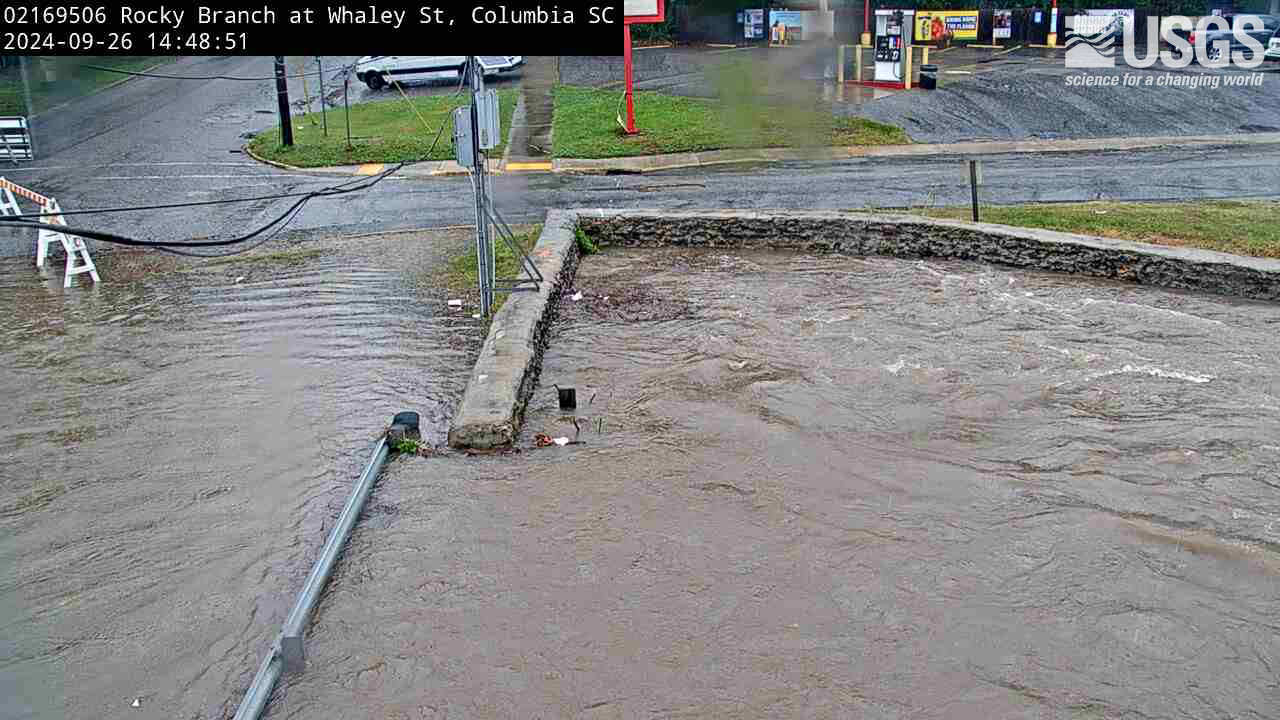
Roadway flooding at a Flood Impact Location in South Carolina on September 26, 2024.
What are Flood Impact Locations?
The USGS and partners are working to expand their catalog of Flood Impact Locations around the U.S. Flood Impact Locations are where critical safety or infrastructure features may be vulnerable to flood impacts near a USGS streamgage. Some examples of flood impact locations include stream and river embankments, roads, bridges, pedestrian paths, and buildings. The RT-FI API delivers the location of cataloged Flood Impact Locations and the associated relevant streamgage information so that you can stay prepared.
Why does USGS identify these Flood Impact Locations?
Because you - the water data users - have asked for it! We are often asked questions like “Would you be able to tell me at what gage height for streamgage 02444160 on the Tombigbee River does the nearby Hwy 388 flood?” The Real-Time Flood Impact API and Map provides the data needed to answer these questions for yourself.
How does USGS identify these Flood Impact Locations?
Flood Impact Locations are surveyed and associated with a nearby USGS real-time streamgage. When the streamgage water level (or gage height) exceeds the Flood Impact Location’s surveyed height, its status will change to “flood”; indicating that location has hit a threshold where flooding is imminent or it is already under water. Using the API data, you can compare the USGS streamgage height against the Flood Impact Location site to compare how close that location is to the current water level. Some Flood Impact Locations may be measured below the level of actual flooding to provide an early warning that flooding may be imminent.
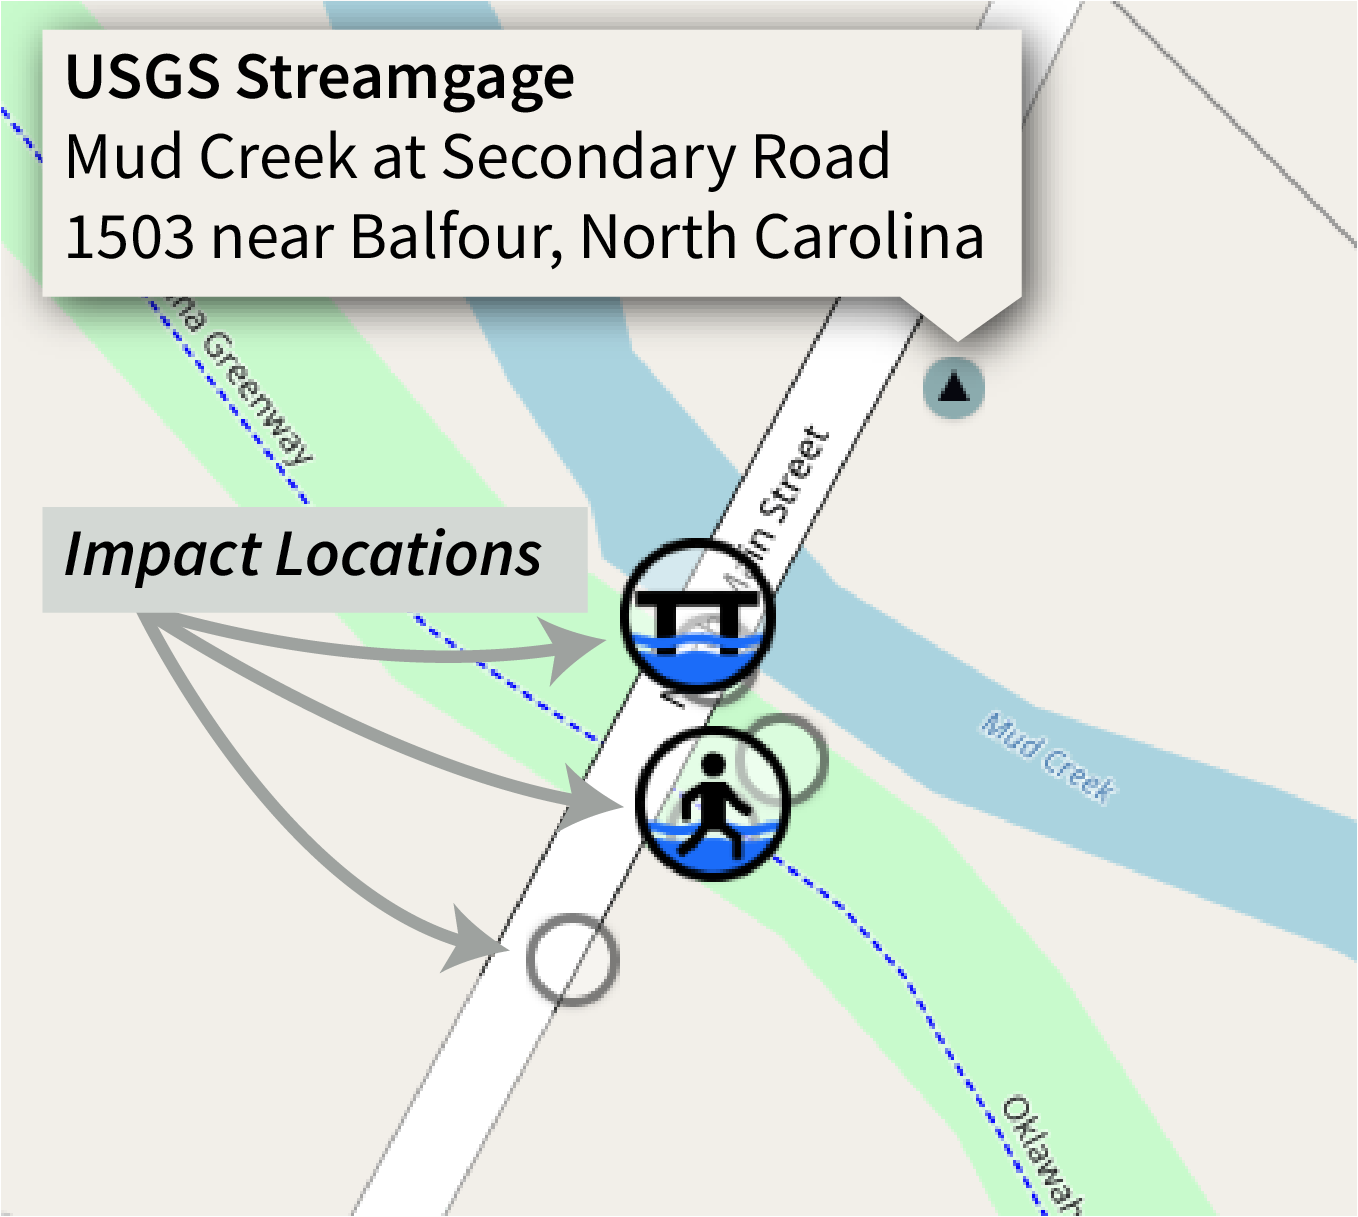
USGS streamgages, such as the one shown here, provide real-time water level data which informs nearby Impact Locations. In this example, the USGS Streamgage is northeast of several identified Impact Locations, two of which are flooded. Because each Impact Location has an associated water level at which it reaches "flood" status, some Impact Locations may flood sooner than others.
How can I access this information?
For further details and for access, the Real-Time Flood Impact API service is available through the modernized Water Data APIs site . Learn more about the Water Data APIs in our previous blog post.
On the Real-Time Flood Impact API service, you can get current and past Flood Impact Location data in several different ways:
- By reference points, including active, inactive, and currently flooding locations
- By counties
- By states
- Cross-referenced to National Weather Service and USGS Streamgage sites
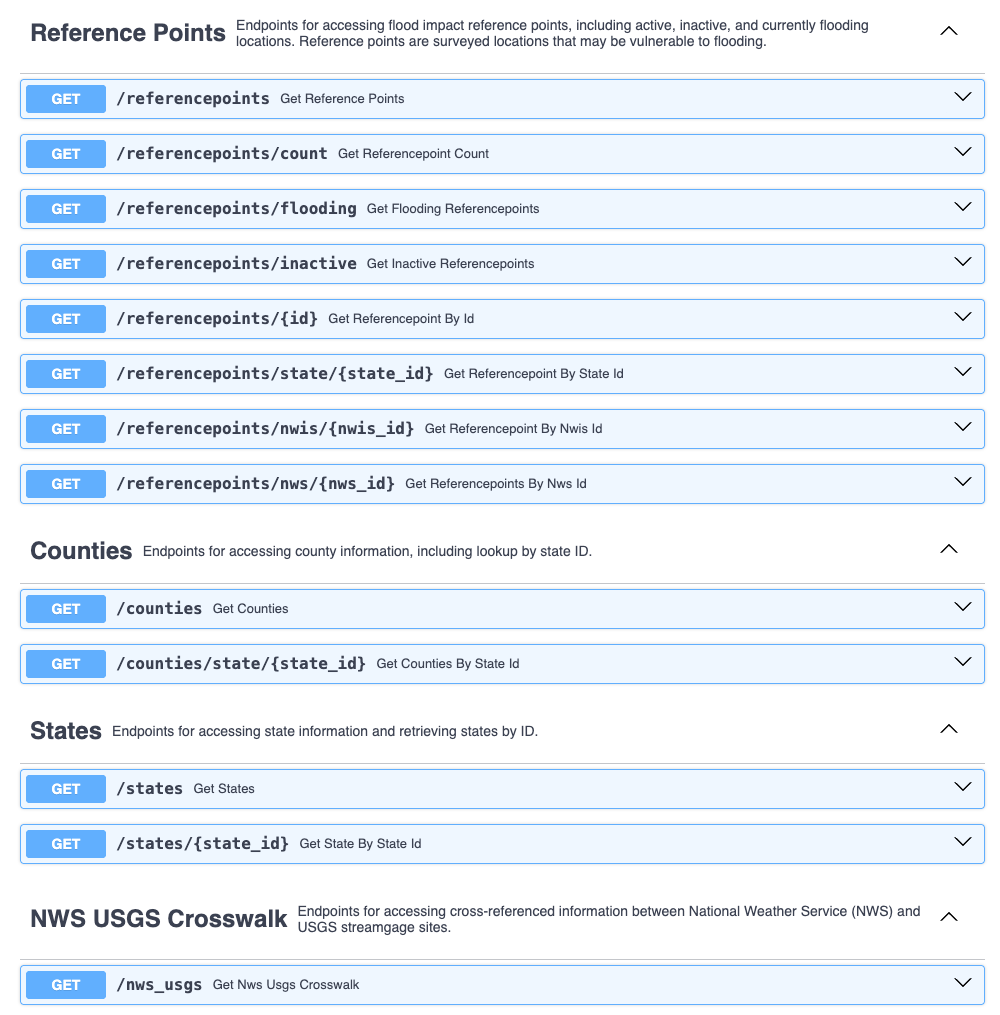
The Real-Time Flood Impact API interface allows the user to interact with and download Flood Impact data in various ways, including identifying Impact Locations (reference points) that are currently in Flood status.
You can also access the Real-Time Flood Impact data through an online map
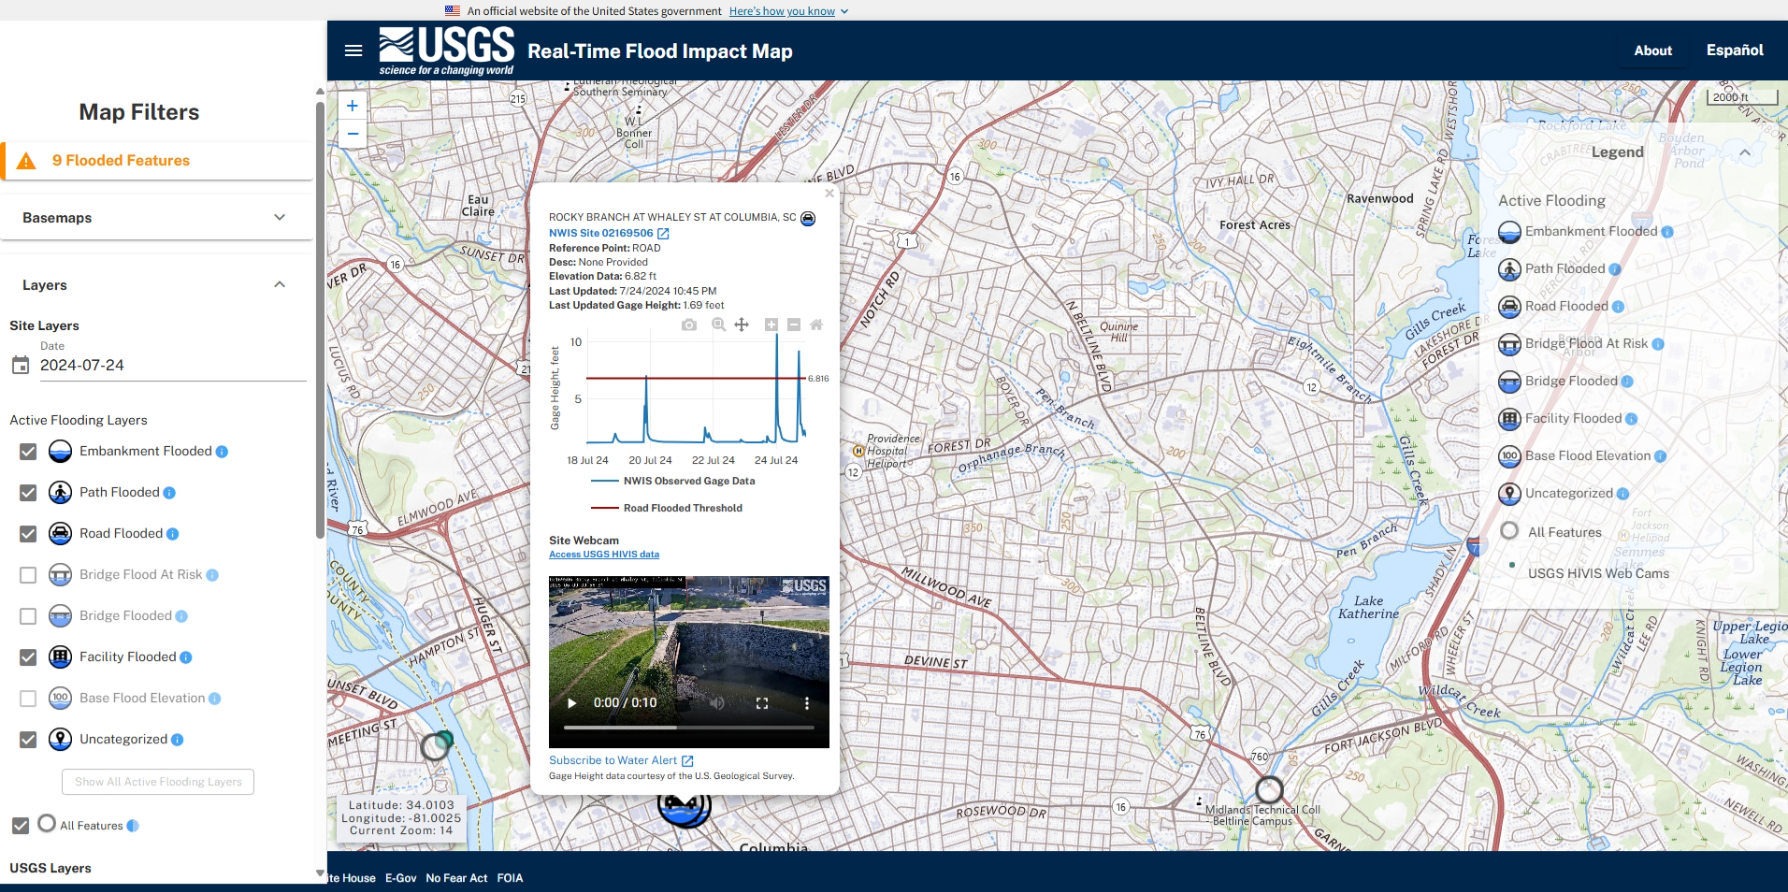
The Real-Time Flood Impact Map allows users to interact with Flood Impact Locations by combining streamgage hydrographs with flood status.
Categories:
Related Posts
Big changes to USGS Water Data in 2025
May 28, 2025
Public USGS Webinar: Water Data for the Nation – New Features and NWISWeb Decommissioning
In this webinar, we highlight important changes in how we deliver water data. These changes are part of a long-term effort to modernize our Water Data for the Nation (WDFN) systems, improve performance, and better serve both internal and public users.
What's new with WDFN APIs?
May 21, 2025
USGS Water Data APIs Homepage and Informational Webinar are available!
We have continued to modernize Water Data APIs. Keep visiting this blog for more updates
Metadata in Water Data for the Nation
December 29, 2025
Introduction
Metadata are crucial to interpreting and understanding USGS water data. Metadata are data that provides information about other data. They provide important context to the water data you are viewing on WDFN pages or downloading from USGS Water Data APIs . USGS water data metadata includes codes and abbreviations, such as parameter codes, method codes, and observed properties.
Daily data in Water Data for the Nation
November 21, 2025
There have been a lot of changes to how you access USGS water data as we work to modernize data delivery in WDFN and decommission NWISWeb. As we centralize and re-organize data delivery in WDFN, we have recently set out to describe different types of water data according to data collection categories . We started with re-organizing and expanding the data collection categories that are delivered on the Monitoring Location Page and are now working to deliver additional data collection categories on other WDFN pages as well. This blog is part of a series to help orient you to where you can find different types of data in WDFN pages and services. In this post, we want to focus on how you can access daily data in WDFN.
Decommissioning Legacy gwlevels and SensorThings APIs – Fall 2025
September 23, 2025
Background
For over 15 years, the USGS has provided machine-readable and automated access to water data via the WaterServices family of application programming interfaces (APIs), which are hosted at https://waterservices.usgs.gov/ . These APIs underpin all other USGS web delivery products – including products such as the National Water Dashboard and Water Data for the Nation (WDFN) – and have been incredibly effective at delivering water data to the public. Between October 2024 and March 2025 alone, these legacy APIs have handled more than 1.6 billion requests from almost 3.5 million distinct IP addresses.