
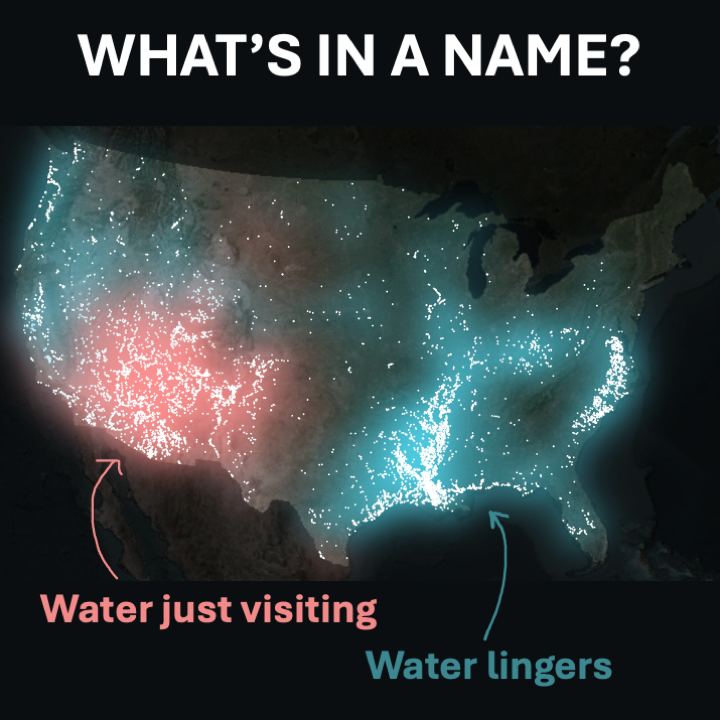
Building firefly-style maps in R to see patterns in stream names across United States.
Official websites use .gov
A .gov website belongs to an official government organization in the
United States.
Secure .gov websites use HTTPS
A lock (
) or https:// means you’ve safely connected to the .gov website. Share
sensitive information only on official, secure websites.
Building firefly-style maps in R to see patterns in stream names across United States.
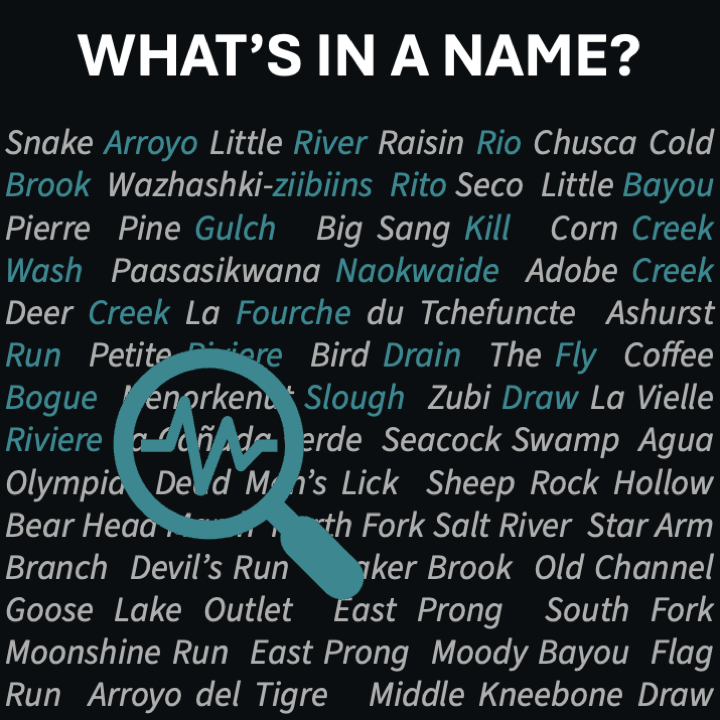
Building a reproducible system for identifying the generic feature words from stream names using R.
Plotting hydrography data has never been easier with the latest versions of nhdplusTools and ggplot2. This blog demonstrates how to fetch and map National Hydrography Dataset (NHD) rivers and waterbodies with several reproducible examples.
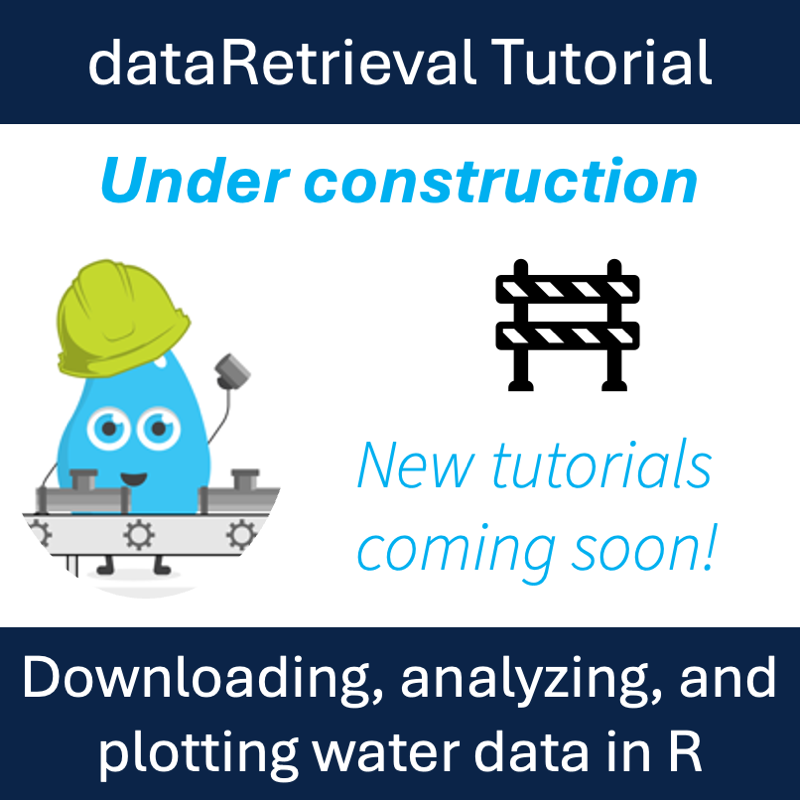
This is a basic dataRetrieval tutorial for USGS water data in R in which we highlight new functionality for dataRetrieval and the new Water Data APIs.
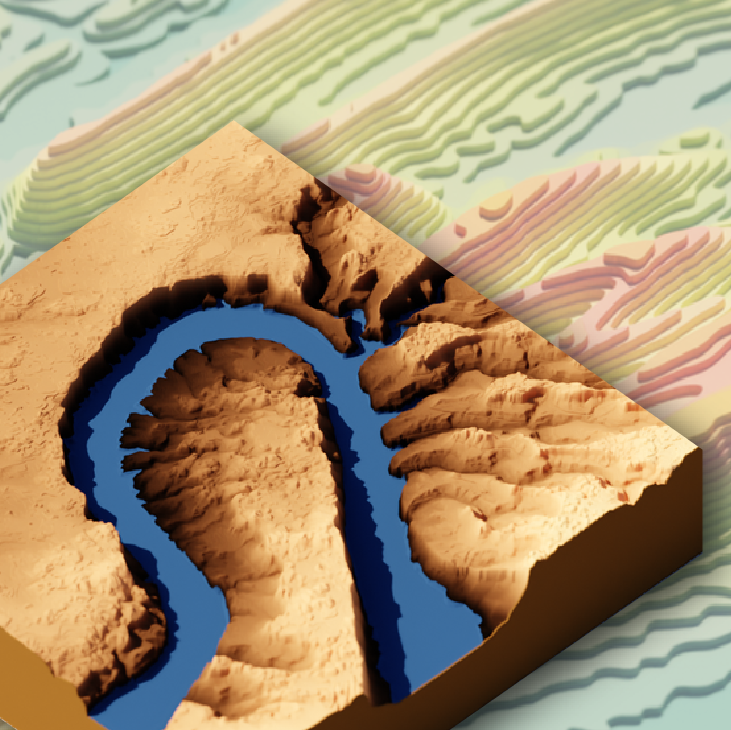
Reproducible workflows that provide the data and tools for you to get started making your own 3D graphics of topographic, satellite, and water data
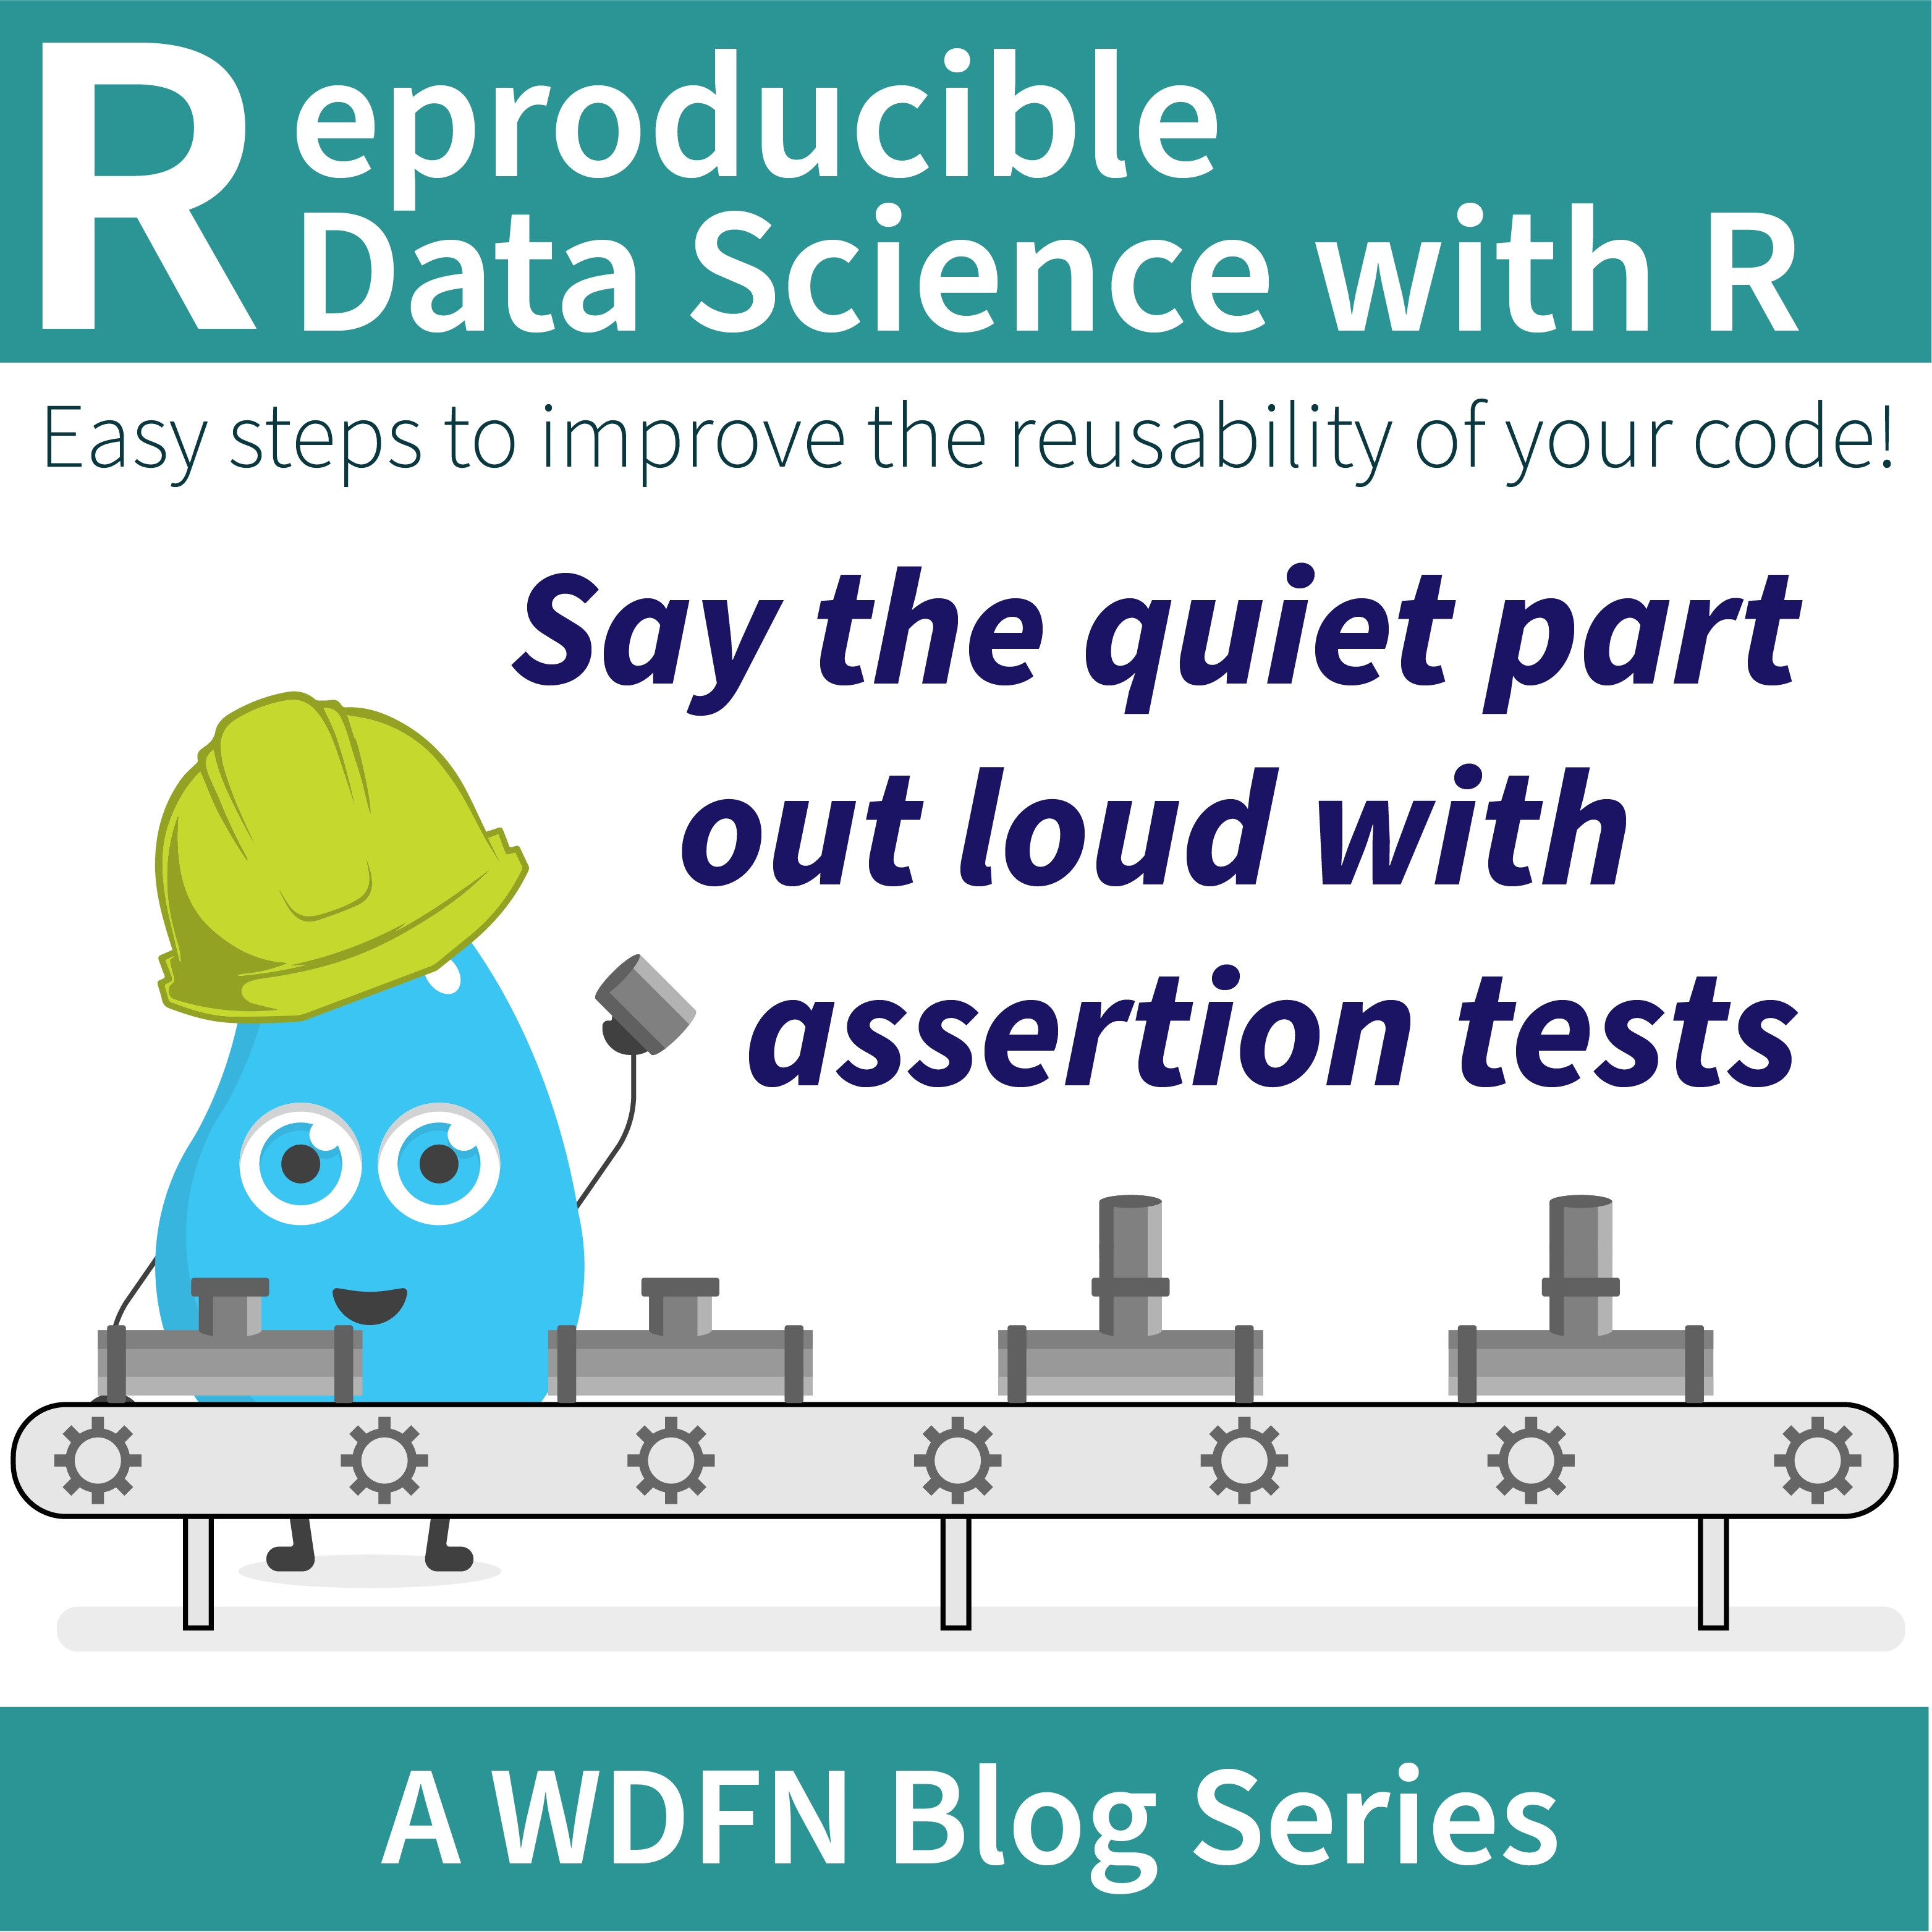
Add assertion tests to your functions to ensure assumptions are met and errors are helpful.
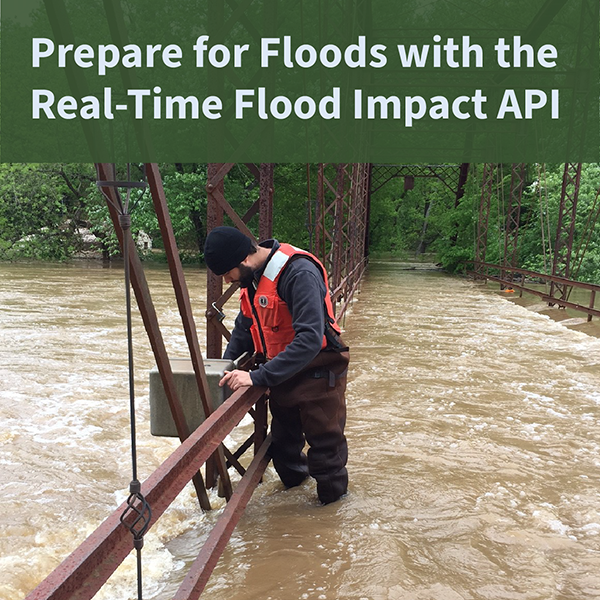
The USGS Real-Time Flood Impact (RT-FI) API service helps communities protect lives and property by providing flood risk context to widely-available USGS streamgage height measurements.
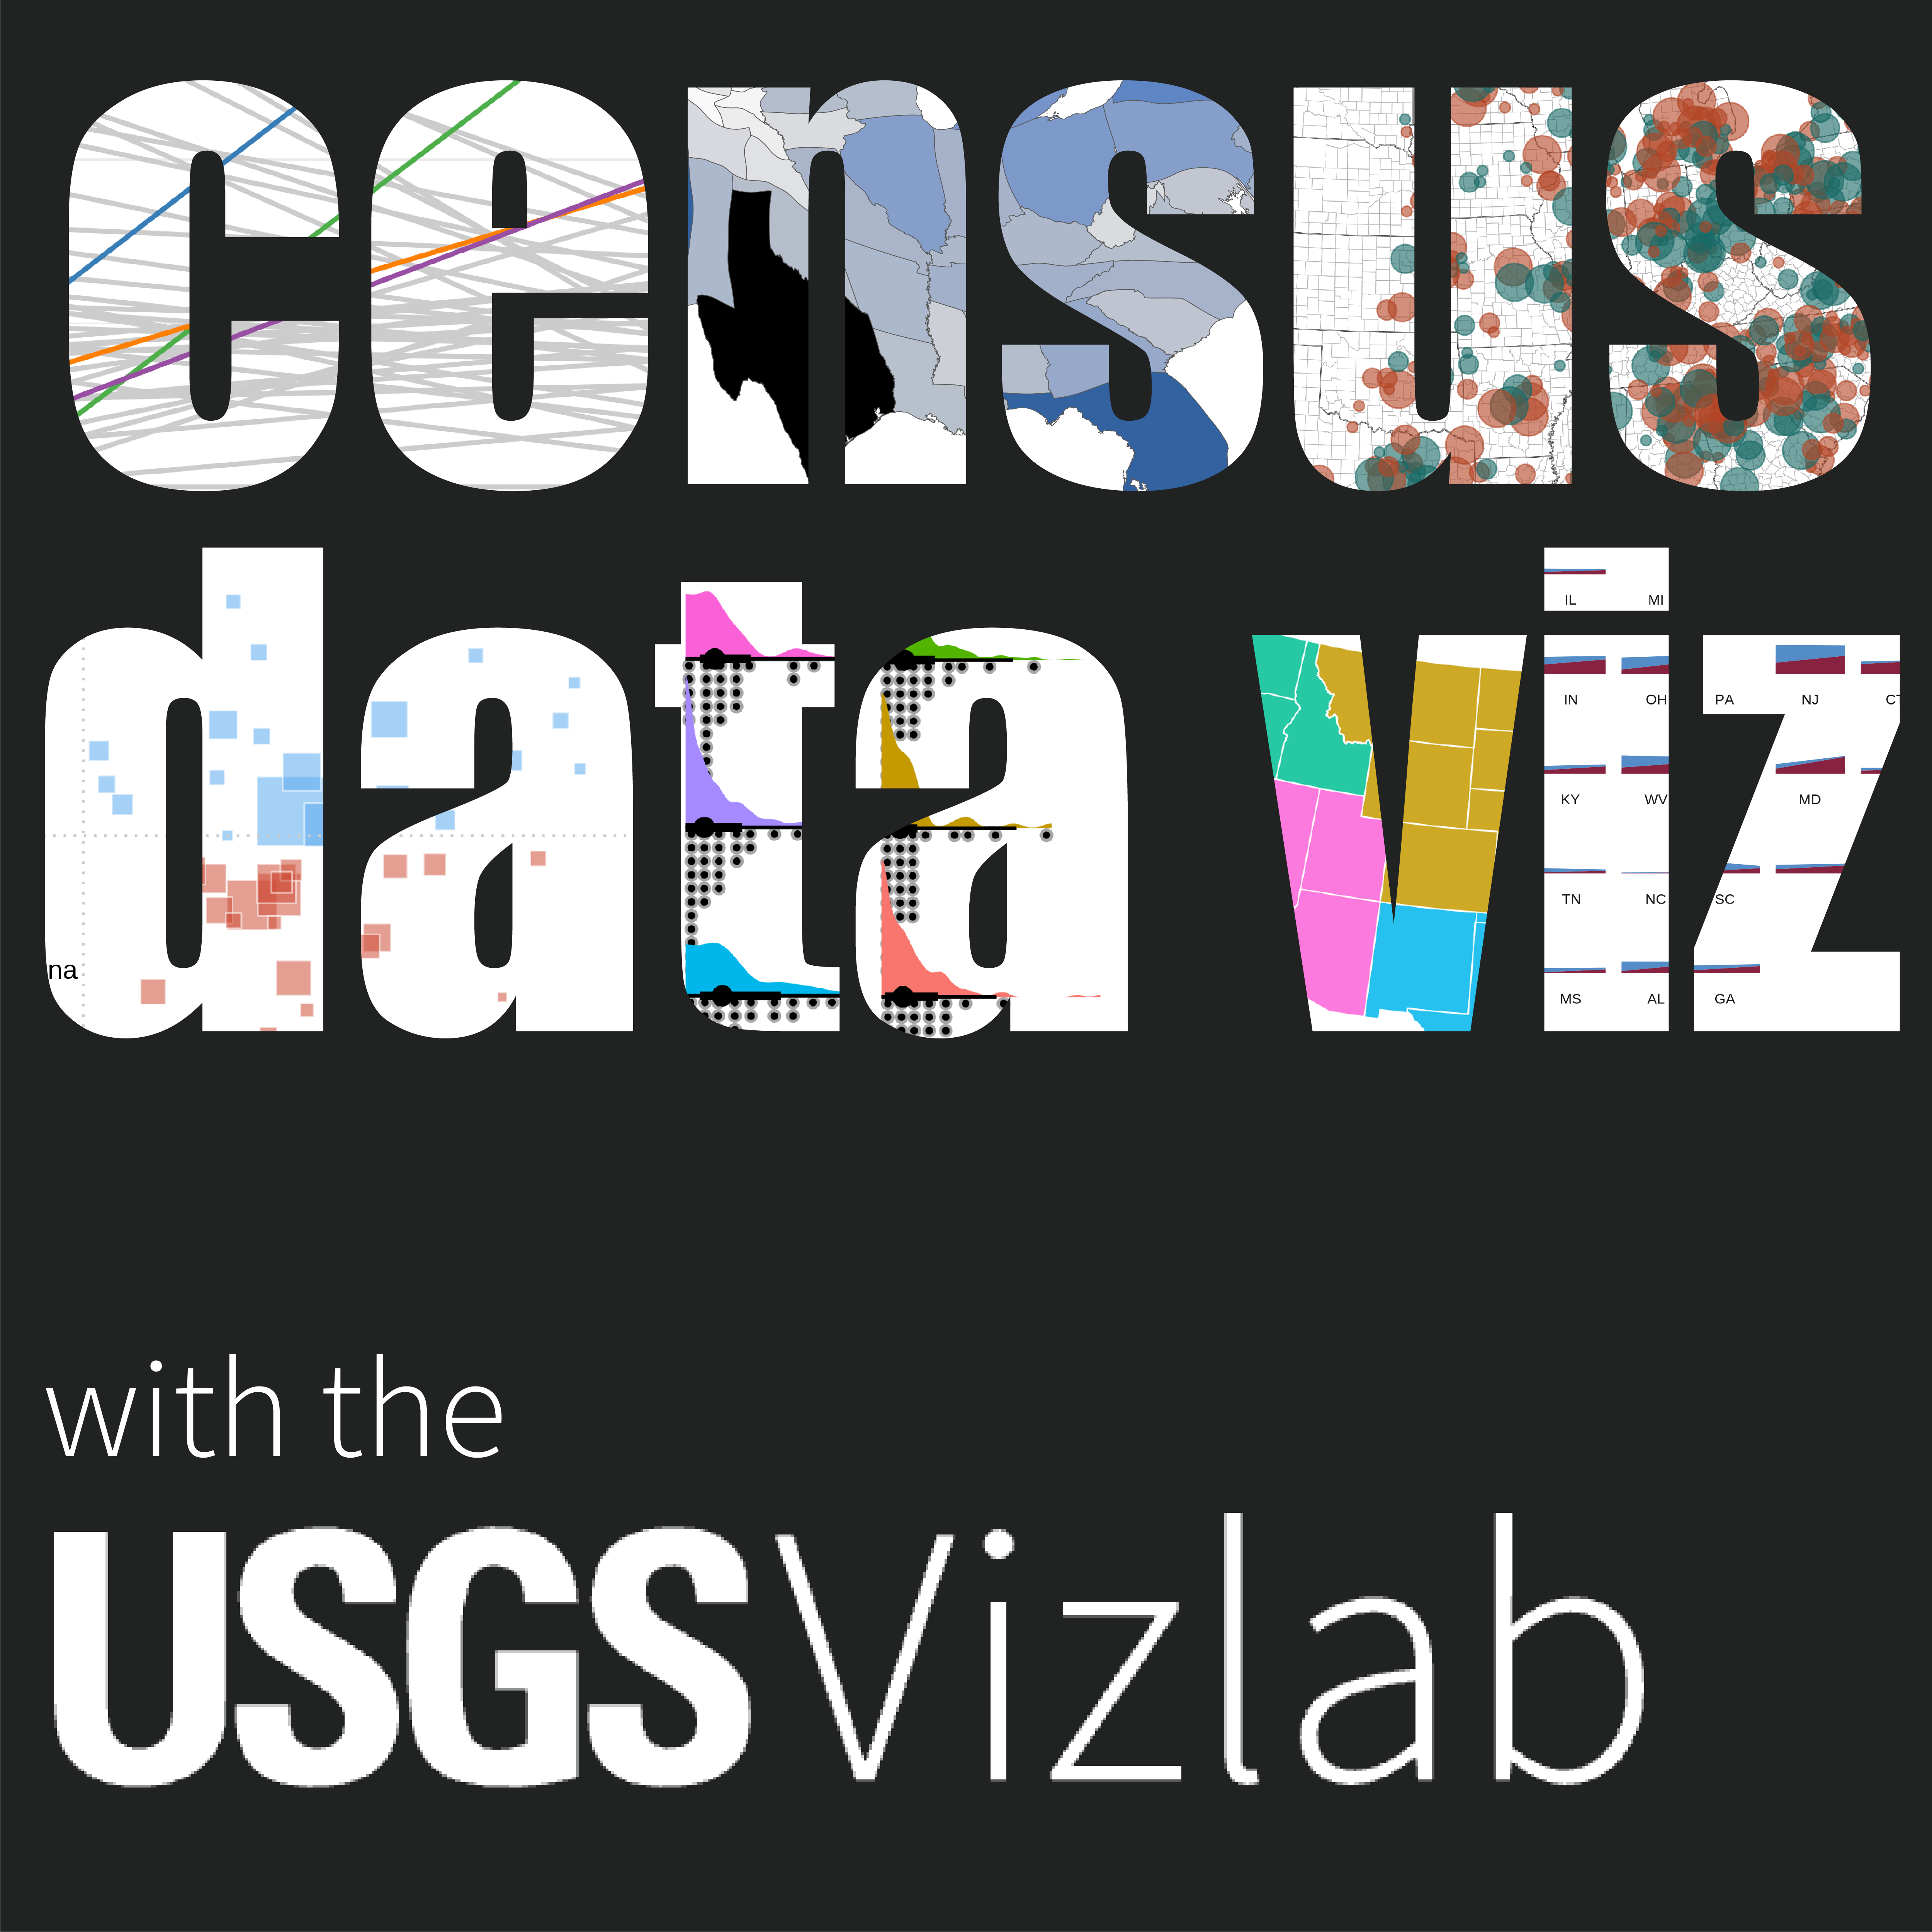
This blog shows several different ways to visualize data from the tidycensus package for R.
What to expect from modernized replacements to the WaterServices family of APIs.
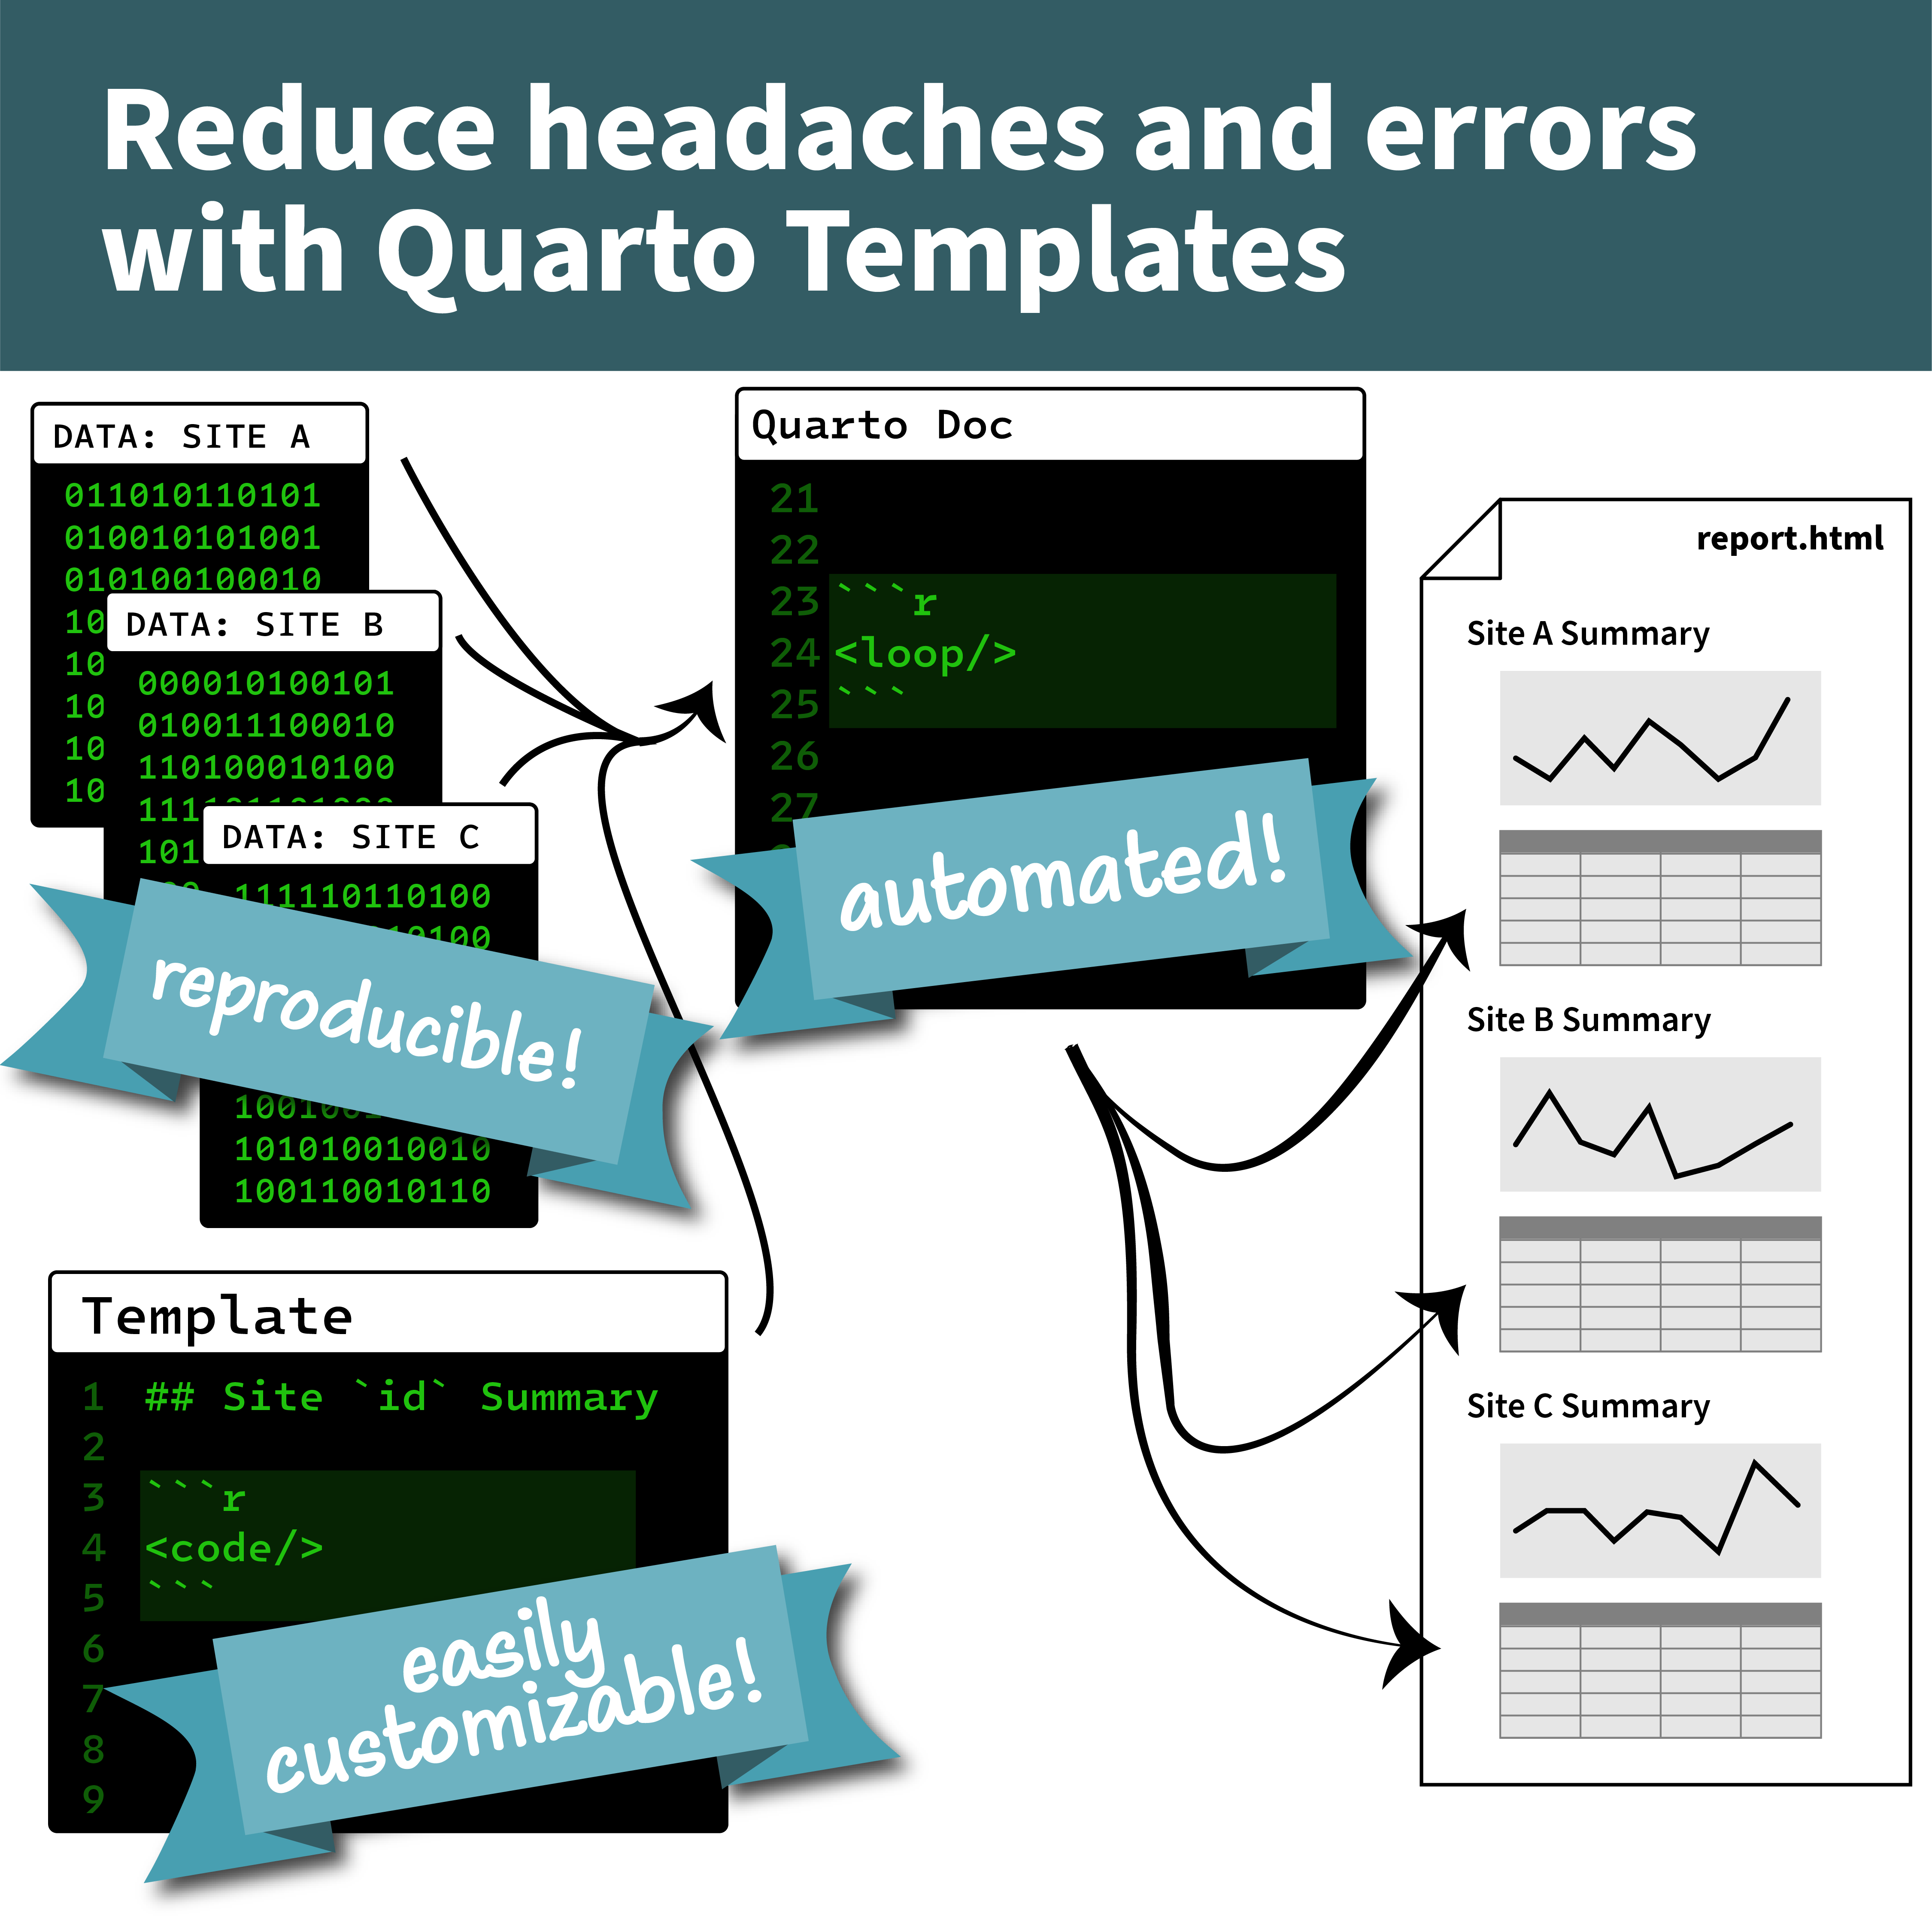
Quarto provides easier-than-ever ways to create data-driven, reproducible documents. This blog demonstrates how to use custom code templates to easily replicate code chunks with a reproducible USGS streamgage example!